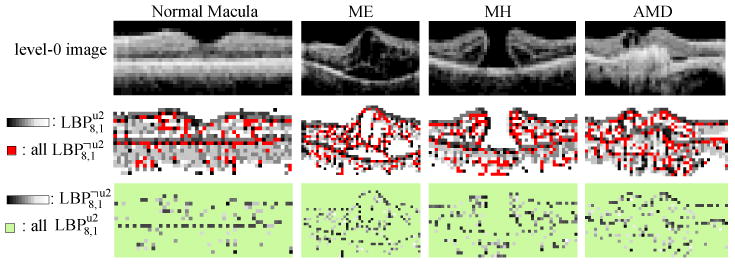
Figure 7.

Visualization of and on example level-0 images. All are shown in red in the 2nd row, and the individual codes are shown in gray-level in the 3rd row. We find that although patterns have low counts, most of them reside in the important contours and can therefore be useful for discrimination.
