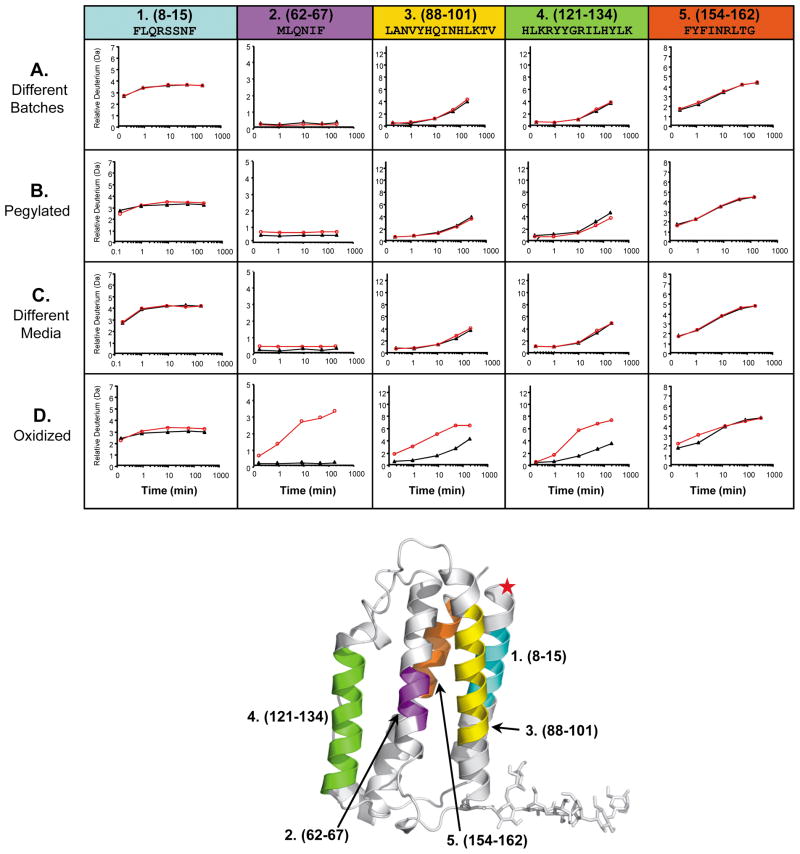
Figure 3.
A small subset of deuterium incorporation graphs generated for five IFN peptic peptides from four different IFN H/DX-MS comparability experiments. In each graph, the reference IFN data is the black line with closed triangles while the experimental IFN data, to which it is being compared, is the red line with open circles. Row A: comparison of two different large scale IFN batches prepared over 8 years apart; Row B: comparison of IFN versus N-terminally pegylated IFN; Row C: comparison of IFN produced using different cell culture media and growth conditions; Row D: comparison of IFN versus oxidized IFN (oxidation of Met and Cys residues C17, M1, M36, M62, M117 was 100% as indicated by LC/MS peptide mapping, data not shown). Columns 1–5 represent five (of the 67) different IFN peptic peptides that were identified and monitored in all IFN H/DX-MS comparison experiments. Each column (peptide) is designated with a specific color, shown at the top. The actual position of these peptides in the three-dimensional structure of IFN is shown with the same color code on the x-ray crystal structure of human IFN (PDB:1AU1 67) located at the bottom of the figure. A red star indicates the position of the pegylation.

