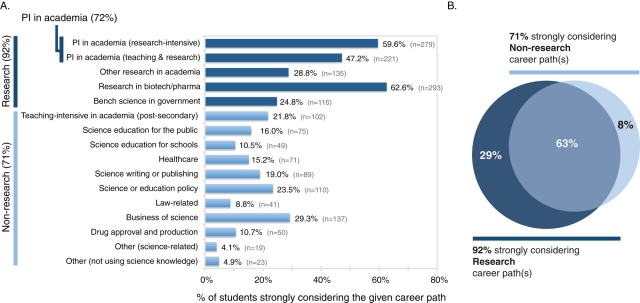
Figure 1.
Graduate students are strongly considering a range of career options. (A) The bar graph shows the percentage of all student respondents who chose each category as one of the career path categories they were strongly considering (respondents could choose more than one category). Overall, 92% of students were strongly considering at least one category of research careers (represented by bars in dark blue), with 72% of all students strongly considering becoming a PI at a research-intensive academic institution and/or a PI with a balance of teaching and research. Seventy-one percent of all students were strongly considering at least one category of careers that typically do not directly involve performance of research (labeled as “non-research” careers and represented by bars in light blue). (B) As illustrated in this Venn diagram, many students (63%, n = 297) were strongly considering both research and non–research career paths.

