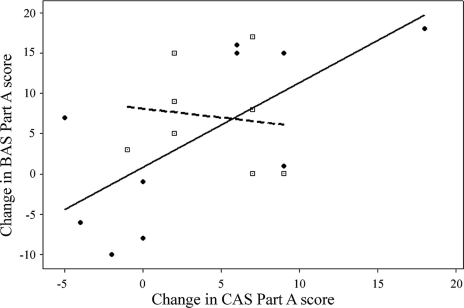
Figure 5.
Scatterplot showing the association between the BAS Part A scores and the CAS Part A score for the Sensory Biology class. Two trend lines are shown; those who scored above the class median on the content knowledge pretest show no association between the two scores (dashed line, p = 0.749). Students scoring at or below the median on the pretest content knowledge show a positive association (solid line, p = 0.030). Those who initially knew less about biology seem to have a stronger linear association between BAS and CAS Part A scores, on average.

