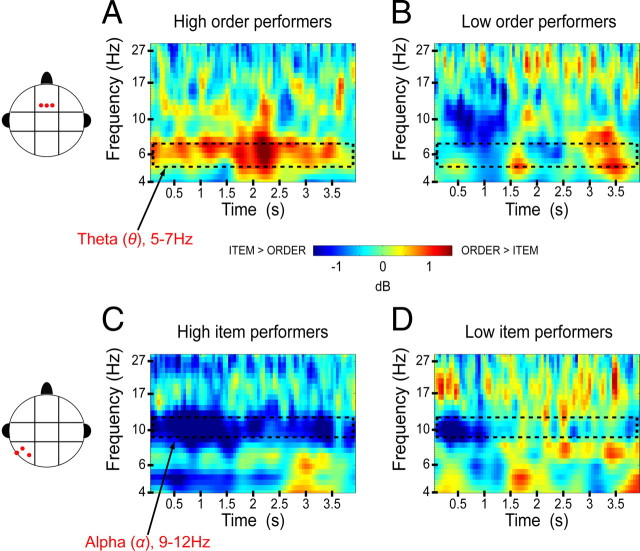
Figure 4.
Theta and alpha effects for high and low performers on the working memory tasks. A, Averaged spectrogram of the order − item power difference for the top 10 order performers at the middle-frontal electrode cluster. B, Averaged spectrogram for the bottom 10 order performers, showing the same contrast and electrode cluster as in A. C, Averaged spectrogram of the order − item power difference for the top 10 item performers at the left-posterior electrode cluster. D, Averaged spectrogram for the bottom 10 item performers, showing the same contrast and electrode cluster as in C.

