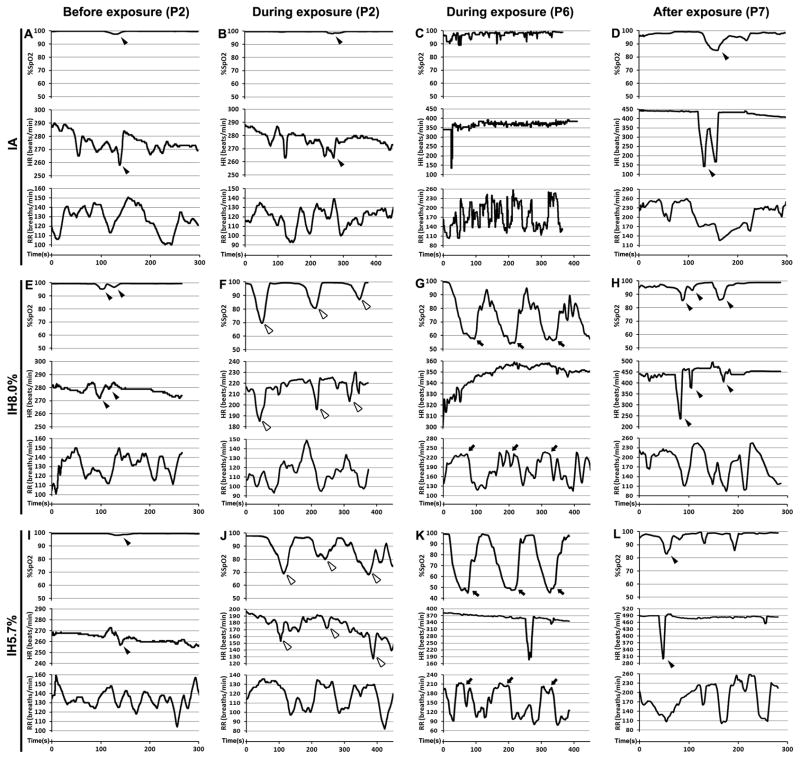
Figure 5.
Effect of IH on pulse oxygen saturation (SpO2), heart (HR) and respiratory (RR) before, during and after exposures in P2, P6 and P7 neonates. Representative graphs of SpO2, HR, and RR under IA (A–D) and IH (E–L) exposures with a nadir of 8% (E–H) or 5.7% FIO2 (I–L) were shown at lower time scales.

