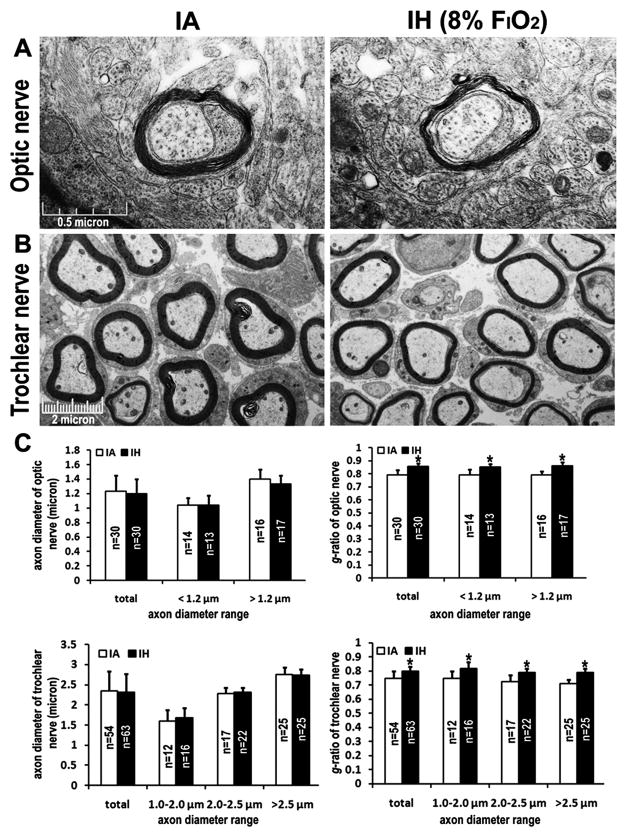
Figure 6.
Representative electron micrographs of myelin ultra-structure in transverse sections of P10 optic and trochlear nerves under IA or IH (8% FIO2) exposures, respectively. The transverse sections for EM examination were prepared from distal optic nerve (A) and trochlear nerve (B). (C) The average of axon diameters and g-ratios categorized by axon diameter range in IA- and IH-exposed groups. N: the number of total axons randomly captured from three different fields of each section per pup and three pups for each group. Error bar: standard deviation. Scale bar: μm. * represents p<0.01

