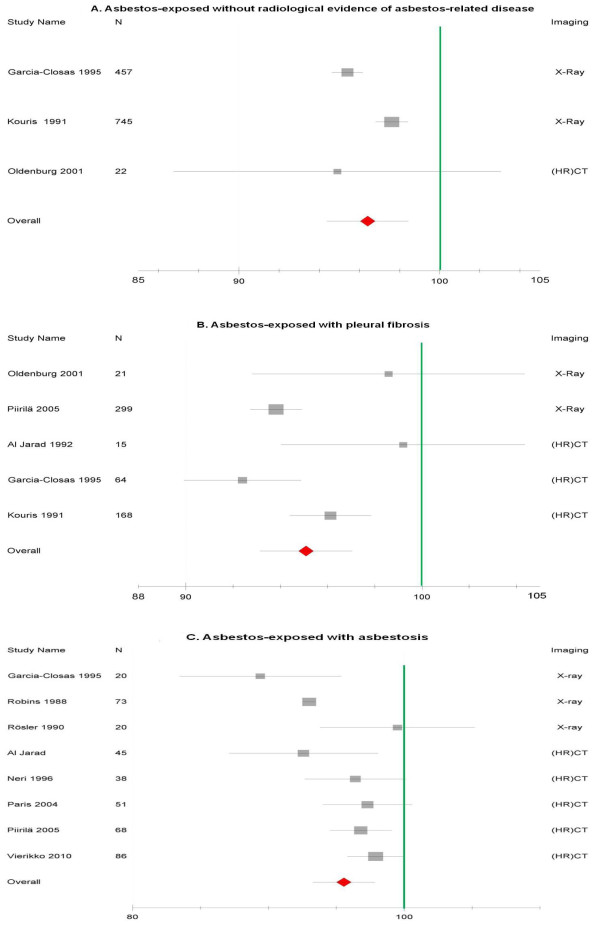
Figure 4.
Forest plot of FEV1/FVC (expressed as percent predicted with 95%CI) in asbestos-exposed collectives grouped according to the radiological status. 4A shows the subgroups without asbestos-related diseases, 4B shows the subgroups with pleural fibrosis and 4C shows the subgroups with asbestosis.

