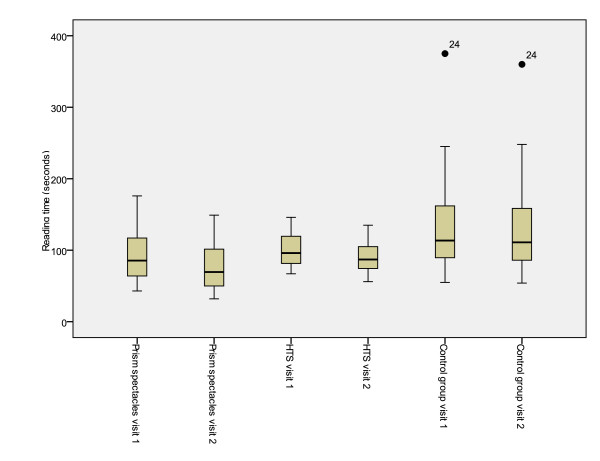
Figure 2.
Box plots of total reading time at first and second visits for each subject group. The top of the box represents the 75th percentile, the bottom of the box represents the 25th percentile and the middle line represents the 50th percentile. The whiskers represent the highest and lowest values (excluding outliers). Outliers are represented by the closed circles. Asterisks represent extreme values.

