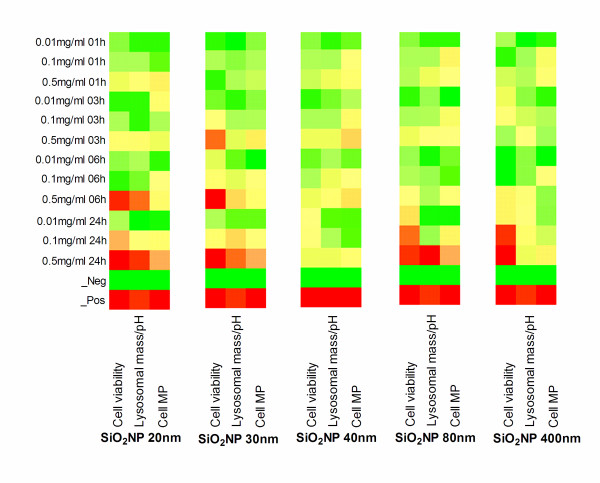
Figure 4.
Heatmaps tables illustrating toxicity indicated parameters in THP-1 cells exposed to SiO2NP. THP-1 cells growing on 96-well plates were exposed to various concentrations (0.01, 0.1, or 0.5 mg/ml) of 20 nm (A), 30 nm (B), 40 nm (C), 80 nm (D), or 400 nm (E) SiO2NP for 1 h, 3 h, 6 h, or 24 h. Multiparametric high content screening analysis for cell count (left column), Lysosomal mass/pH (middle column) and cell membrane permeability (MP) (right column) was performed using an automated IN Cell Analyzer 1000 microscope and IN Cell Investigator image analysis software. Data represents three independent experiments performed in triplicate samples. Heatmaps were generated for the above indicated parameters and their colorimetric gradient table spans from: Dark green = lower than 15% of maximum value measured; Bright green = 30%; Yellow = 50%; Bright Orange = 60%; Dark Orange = 75%; Red = higher than 75% of maximum value. Cell viability colour gradients read as percentage of cell loss compared to normalised control (green = low cell viability loss, red = high loss) compared to normalised control. Heatmaps values are normalised using the percent of the positive controls and, Z score was calculated as described in the statistical analysis section.

