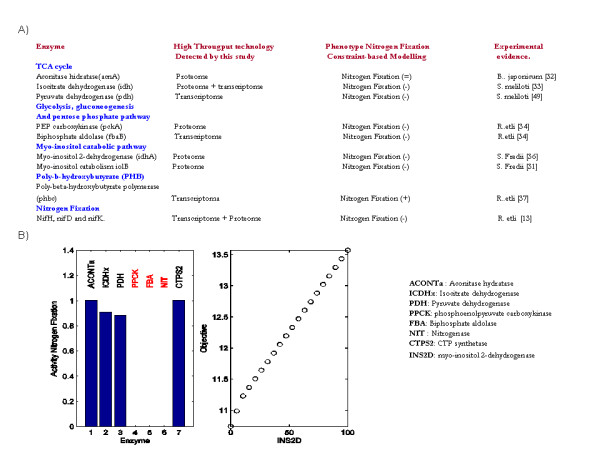
Figure 3.

In silico assessment of gene knockout and phenotype variations on bacterial nitrogen fixation. Panel (A) summarizes the benchmarks used to evaluate the in silico description of nitrogen fixation. Black and blue letter in first column indicates the silenced enzyme its corresponding metabolic pathway respectively. Second column indicates the technology by which the enzymes were identified in this study. Third column indicates the Rhizobiacea used to compare in silico prediction. Forth and fifth columns represent the computational phenotype and the reference supporting the computational result. Sign (+), ( = ) and (-) respectively denotes an increment, invariance and decrement in nitrogen fixation when mutation were accomplished. The in silico phenotype effect carried out by aconitase hydratase (ACONTa), isocitrate dehydrogenase (ICDHx), pyruvate dehydrogenase (PDH), phosphoenolpyruvate carboxykinase (PPCK), biphosphate aldolase (FBA), nitrogenase (NIT) and CTP-synthase (CTPS2) are summarized in left side of panel B. The robustness analysis accomplished for inositol catabolic reaction (INSCT) is shown in panel B.
