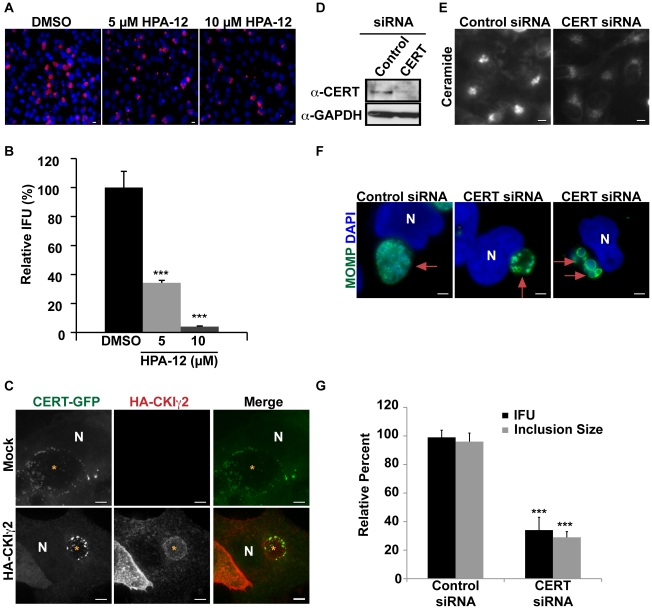
Figure 4. CERT function is required for C. trachomatis replication.
HeLa cells were infected with C. trachomatis L2, treated with the indicated concentration of HPA-12 at 1–24 hpi, and then (A) fixed and stained with antibodies to MOMP (red) and with DAPI (blue) to visualize bacteria or (B) analyzed for progeny formation. Values (mean ± standard error) are shown as percentage of DMSO treated samples. Data are representative of 3 independent experiments. ***p<0.001 compared to DMSO treated cells (ANOVA). (C) HeLa cells were transfected with CERT-GFP and HA-CKIγ2 for 18 hrs, infected with C. trachomatis L2 for 24 hrs, and then fixed and stained with antibodies to HA (red). The exposure time for each filter set of all images was identical. Images shown are maximum intensity projections of confocal z-stacks (0.4-µm slices). Ectopic expression of HA-CKIγ2 decreased inclusion size but did not affect CERT-GFP recruitment to the inclusion membrane. Scale bar = 5 µm. (D) Western blot analysis of siRNA-treated samples. GAPDH was used as a loading control. (E) HeLa cells were depleted of CERT for 3 days and then labeled with BODIPY FL-Ceramide to analyze SM accumulation in the Golgi. The exposure time of all images was identical. CERT depletion reduced SM accumulation in the Golgi. Scale bar = 5 µm, (F) HeLa cells were depleted of CERT for 3 days, infected with C. trachomatis L2 for 24 hrs, and then fixed and stained with antibodies to MOMP (green) to identify the inclusion. Bacteria and host DNA were detected using DAPI (blue). The exposure time for all images was identical. CERT depletion reduced inclusion size. Red arrows point to inclusions. Scale bar = 5 µm. (G) HeLa cells were depleted of CERT for 3 days, infected with C. trachomatis L2 and analyzed for inclusion size and progeny formation. Values (mean ± standard error) are shown as percentage of control siRNA samples. CERT depletion significantly reduced inclusion size and progeny formation. Data are representative of 2 independent experiments. ***p<0.001 for CERT siRNA-treated cells compared to control siRNA-treated cells (ANOVA). N, host nucleus. IFU, inclusion forming units. Scale bar = 5 µm.

