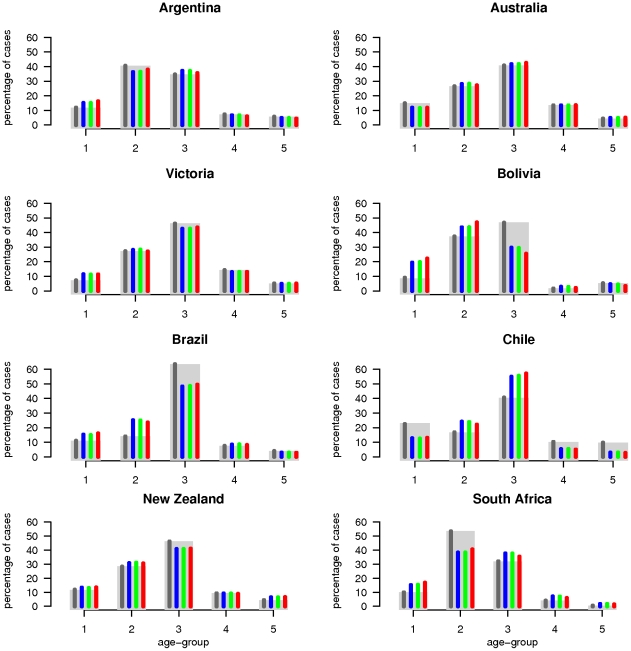
Figure 2. Surveillance data and model estimates for the age-distribution of cases.
Observed cumulative cases distribution among age-groups (grey rectangles) and model median posterior estimates (coloured thin bars). The dark grey bars correspond to country-specific fits, whereas blue, green and red bars represent the results for M1, M2 and M3 model variants of the global model, respectively.

