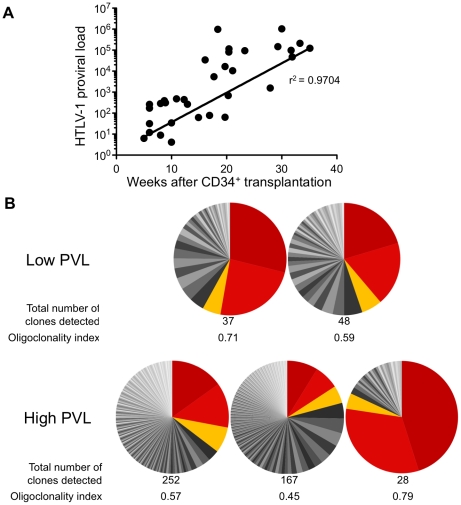
Figure 3. Proviral load and clonality in HTLV-1-infected HIS Rag2-/-γc -/- mice.
(A) Temporal evolution of proviral load (PVL) in the thymus. The HTLV-1 PVL (representing the copy number of tax per 105 human cells) were determined by quantitative real-time PCR at the indicated times after CD34+ cell transplantation. The PVL level correlates with the length of the infection period (r2 = 0.9704). Samples were analyzed at least in duplicate; on all graphs, one dot represents one individual HIS Rag2-/-γc -/- mouse. (B) Clone frequency distribution of HTLV-1 infected cells in the spleen from 5 different mice. The HTLV-1 clonal structure in each genomic DNA sample is depicted by a pie chart. Each slice represents one unique insertion site (clone); the size of the slice is proportional to the relative abundance of that clone. The 3 most abundant clones were colored in red/orange in each spleen sample. The total number of detected clones was given together with the oligoclonality index values calculated as described in [20].

