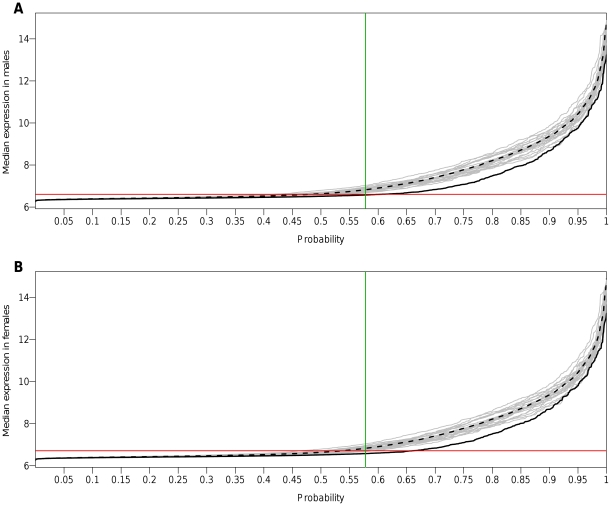
Figure 3. Quantile functions of median expression levels of X-linked and autosomal transcripts in human monocytes.
(A) Males and (B) Females: X-linked transcripts are shown by the plain black curve, autosomal transcripts by the dashed black curve and each autosome by an individual grey curve. For a probability p (x-axis), the y-axis shows the median expression level below which p×100% of transcripts fall. The horizontal red line corresponds to the filtering performed when selecting transcripts detected in ≥95% of individuals. The vertical green line corresponds to excluding equal proportions (57.5%) of the less expressed genes on the X chromosome and on autosomes separately.

