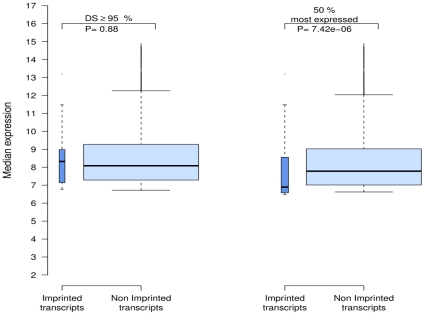
Figure 6. Expression levels of imprinted and non-imprinted autosomal transcripts in human moncoytes.
The graph shows boxplots of expression levels either when filtering the genes according to a uniform detection threshold (detection score (DS) ≥95%) or when excluding the 50% lowest gene expressions separately in imprinted and non-imprinted genes.

