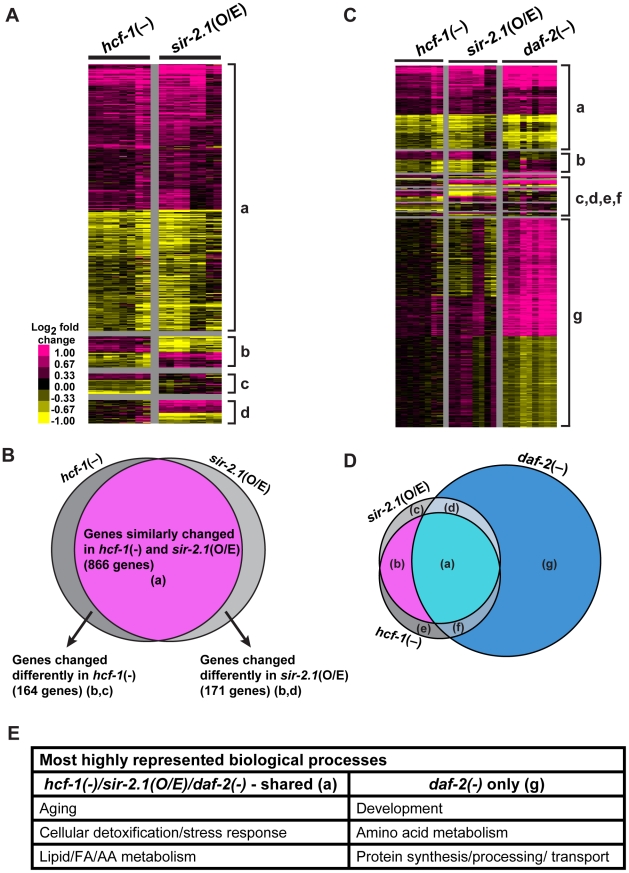
Figure 3. hcf-1 inactivation and sir-2.1 overexpression similarly affect a specific subset of daf-16 downstream target genes.
(A–D) Heat maps representing the expression patterns of differentially expressed genes identified by Significance Analysis of Microarrays (SAM) and Venn diagrams showing the overlap between different datasets. For heat maps, each column represents a biological replicate and each row is a gene. Pink = upregulated, Yellow = downregulated, Black = not changed. (A) Heat maps comparing hcf-1(-) and sir-2.1(O/E) arrays. Gene clusters are categorized as: (a) = Genes similarly changed in hcf-1(-) and sir-2.1(O/E) (866), (b) = genes oppositely changed in hcf-1(-) and sir-2.1(O/E) (98), (c) = genes uniquely changed in hcf-1(-) (66), (d) = genes uniquely changed in sir-2.1(O/E) (73). (B) Venn diagram summarizing overlap in (A). (C) Heat maps comparing hcf-1(-), sir-2.1(O/E), and daf-2(-) arrays. Genes are clustered as (a) = similarly expressed in all 3 profiles (693), (b) = similar in only hcf-1(-) and sir-2.1(O/E) (173), (c) = uniquely changed in sir-2.1(O/E) (130), (d) = similar in only sir-2.1(O/E) and daf-2(-) (26), (e) = uniquely changed in hcf-1(-) (140), (f) = similar in only hcf-1(-) and daf-2(-) (46), (g) = uniquely changed in daf-2(-) (1750) (See also Table S3). (D) Venn diagram summarizing overlaps in (C). (E) Most highly enriched GO terms (See also Table S4A, S4B) are summarized based on general biological process.

