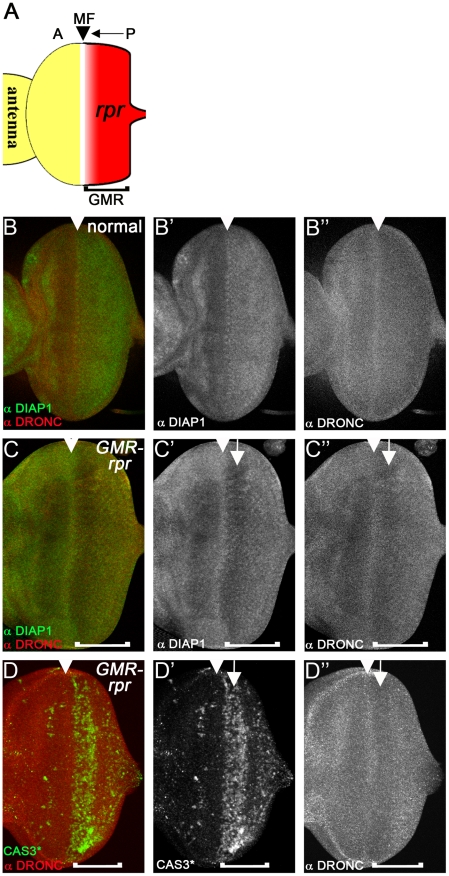
Figure 4. Loss of DIAP1 in GMR-rpr eye discs does not alter DRONC protein levels.
(A) Schematic illustration of the GMR-reaper (GMR-rpr) eye imaginal disc from 3rd instar larvae. The morphogenetic furrow (MF, arrowhead) initiates at the posterior (P) edge of the disc and moves towards the anterior (A) (arrow). The GMR enhancer is active posterior to the MF (bracket) and thus expresses rpr posterior to the MF (red area). (B-B″) Eye disc showing normal protein distribution of DIAP1 (B′) and DRONC (B″). Both DIAP1 and DRONC levels are increased in the MF (arrowhead). (B) is the merged image of DIAP1 and DRONC labeling. (C–C″) Eye discs expressing two copies of GMR-rpr eye disc labeled for DIAP1 (C′) and DRONC (C″). Arrowheads mark the MF. DIAP1 levels are markedly reduced posterior to the MF (C′, arrow). Surprisingly, DRONC protein levels are also reduced (C″, arrow). The brackets indicate the extent of GMR expression. (D–D″) 2×GMR-rpr eye disc labeled for cleaved CASPASE 3 (CAS3*) (D′) and DRONC (D″). DRONC protein levels are reduced in the CAS3*-positive area (arrow). Arrowheads mark the MF. The brackets indicate the extent of GMR expression.

