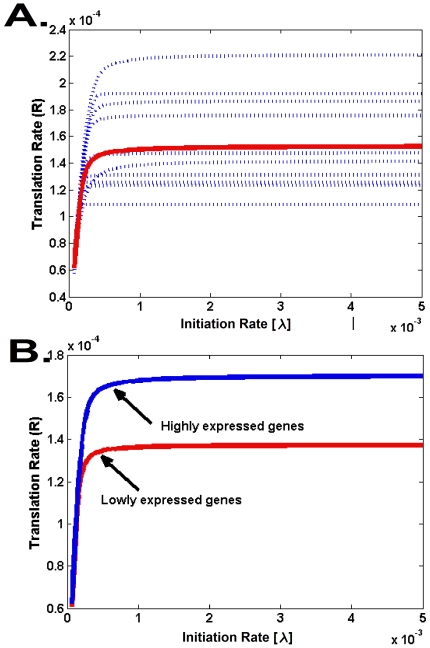
Figure 2. The effect of the initiation rate on the translation rate and elongation rate capacity.
A. The figure depicts ten typical profiles of translation rate vs. the initiation rate  (blue) in S. cerevisiae genes; the mean genomic profile is shown in red. As can be seen, for very small
  values all genes have similar translation rate (mainly determined by λ and not by the codon-bias), whereas for larger λ translation rates differ among genes and asymptotically converge to the elongation rate capacity. B. The predicted translation rate for highly (top 25%, Blue line) and lowly (lowest 25%, Red line) expressed genes.

