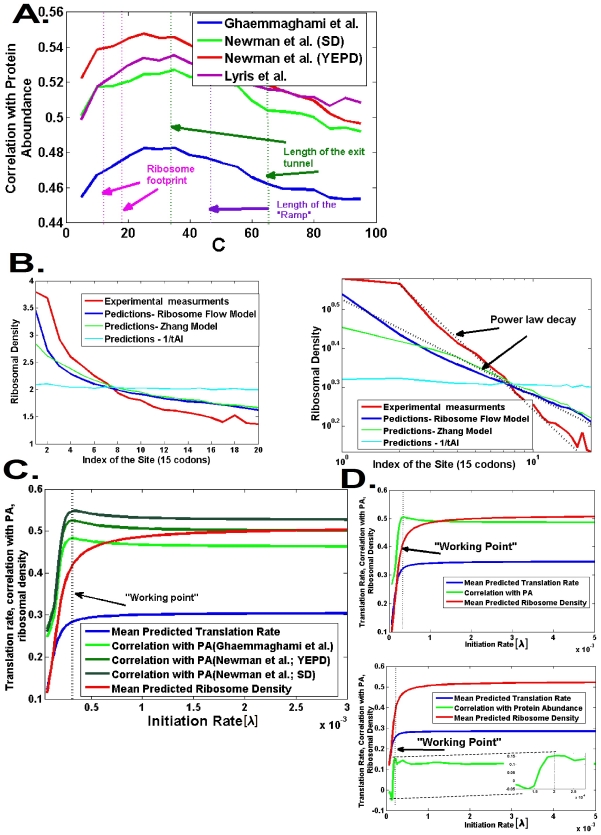
Figure 4. Relations between various quantities predicted by the RFM and biological measurements.
A. Correlation between protein abundance [16]
[15]
[66] and the translation rate for various values of the coarse graining parameter (C in Figure 1); the best results are observed for values which are similar to various geometrical properties of the ribosome (the dashed lines in the figure). B. Right: The RFM predicts the genomic ribosomal density profile [14] better than the tAI or the model of Zhang et al.
[33]; all were normalized to have the same mean. Left – the 5′ region of the genomic ribosomal density profile and the predicted genomic profile of the RFM appear linear on a log-log scale. We used a site size of 15 codons (similar to the size of the ribosome) and a  (initiation rate) value that was independently found to optimize the correlation with protein abundance. C. The relation between λ (associated with the number of available ribosomes in the cell), genomic mean of the translation rate, and the genomic mean of the ribosomal density. D. Initiation rate (λ), translation rate, and ribosomal density for highly expressed genes (up) and lowly expressed genes (down).

