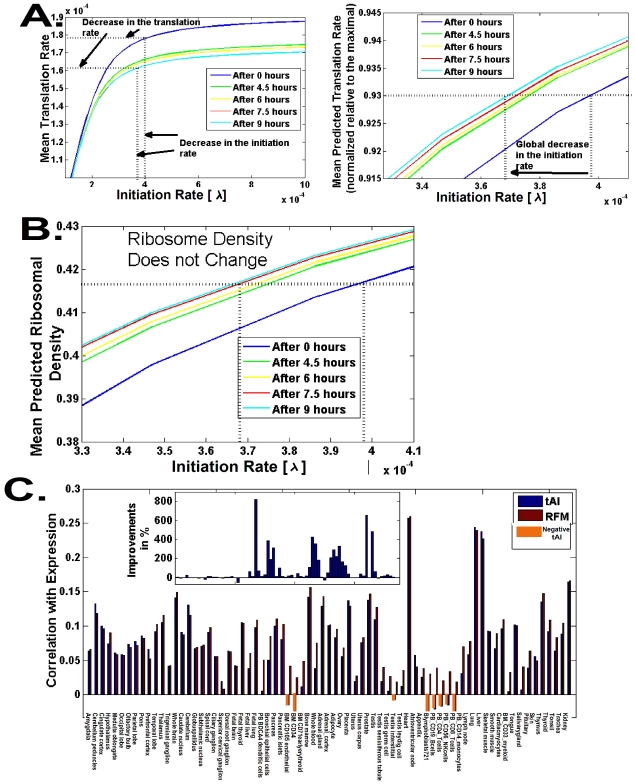
Figure 6. Translation rate and ribosome density during the diauxic shift in S. cerevisiae.
A. The mean genomic translation rate as a function of the initiation rate ( ) for five time points; the dotted lines correspond to the working point just before saturation (93% of the maximal production rate, mentioned in sub-section 4). B. The mean genomic ribosomal density as a function of the initiation rate (
 ) for five time points. The dotted lines correspond to the initiation rates at the working points. C. The correlation between the mRNA levels of genes in different human tissues vs. (a) the RFM predictions and (b) the tAI predictions. Inset: the improvement in correlation in % when using the RFM instead of the tAI.

