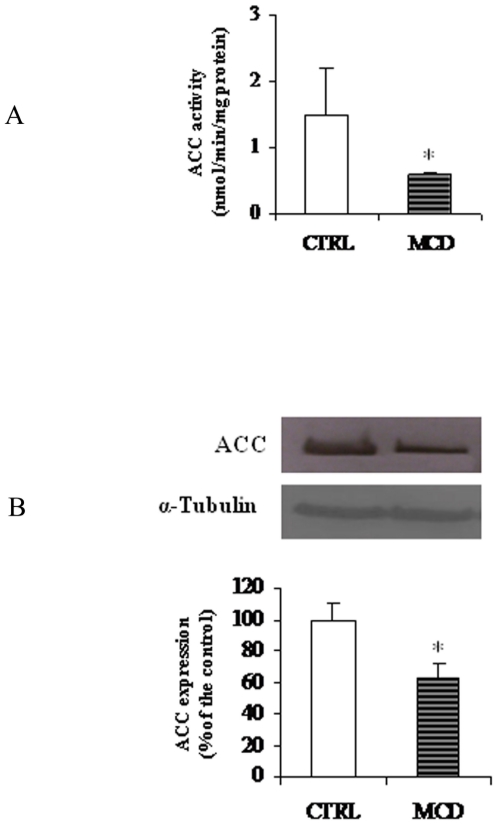
Figure 4. Activity and protein level of acetyl-CoA carboxylase (ACC).
ACC activity (A) and protein level (B) in control (CTRL) and methionine-choline deficient (MCD) diet fed rats were measured as reported in “Methods”. ACC activity is expressed as nmoles [14C]NaHCO3 incorporated into malonyl-CoA/min/mg protein. α-Tubulin was used for signal normalization. Data are expressed as means ± SD of five experiments for each group. Statistical differences were assessed using unpaired t-test assuming variance homogeneity. *Significantly different from the control.

