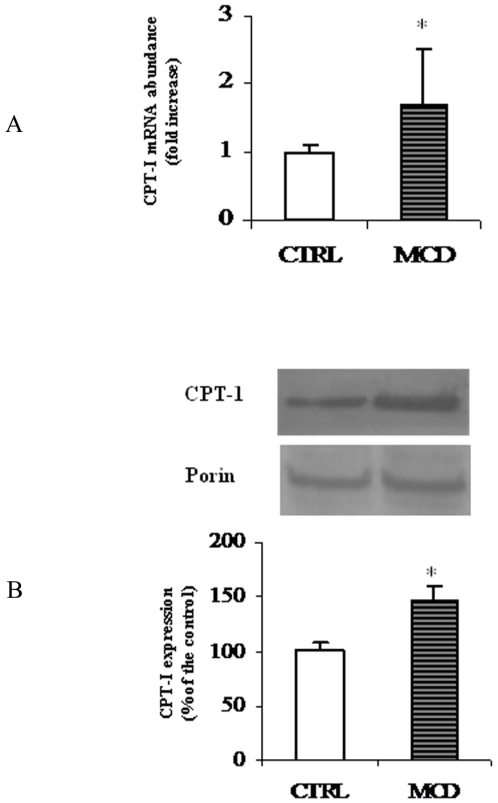
Figure 6. mRNA and protein levels of rat liver CPT-I.
The histogram (A) represents CPT-I mRNA abundance determined using RT-quantitative PCR and expressed as relative amount (18s rRNA as a reference) in liver from control (CTRL) and methionine-choline deficient (MCD) diet fed rats (A). Data are shown as mean values ± SD for the CPT-I gene relative to an arbitrary value of 1, which was assigned to the expression level in control animals. Western blot analysis of CPT-I in liver from CTRL and MCD rats (B) was performed as reported in “Methods”. Porin was used for signal normalization. The content of CPT-I was quantified by densitometric analysis. Data are mean values ± SD of five experiments for each group. *Significantly different from the control.

