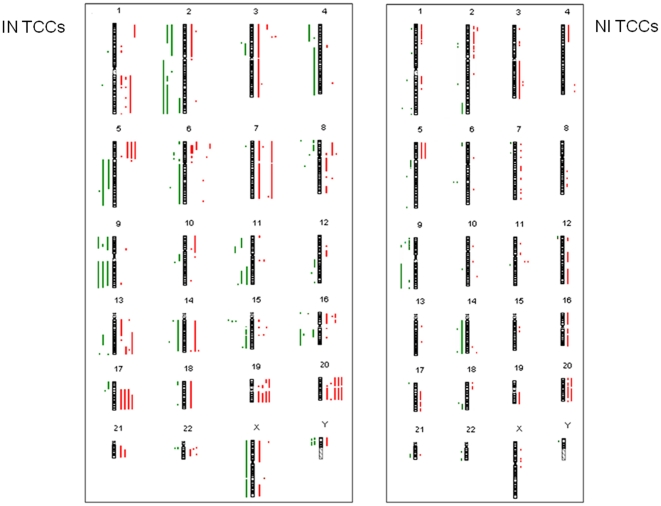
Figure 3. CNA collection evidenced by array-CGH.
CNAs of 10 TCCs samples: 6 infiltrating tumors (IN-TCCs: 70CR09, 81CR09, 04CR10, 09CR10, 10CR10, 26CR10) on the left, and 4 non- infiltrating tumors (NI-TCCs: 28CR09, 75CR09, 80CR09, 82CR09) on the right. Each dot/bar corresponds to one sample. Losses are evidenced in green while gains in red.

