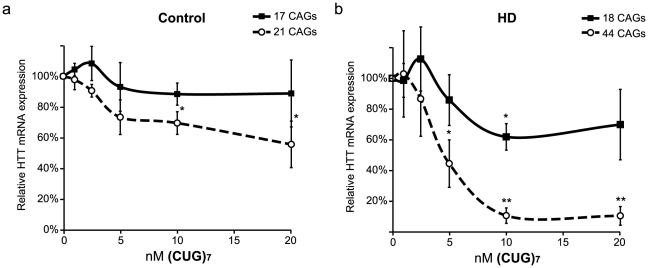
Figure 4. Effect of various (CUG)7 AON concentrations on HTT mRNA expression.
Cells were transfected with 1–20 nM (CUG)7. PCR products with primers flanking the CAG repeat of HTT were quantified by Lab on a Chip. (a) In the control cell line (FLB73) both alleles (17 and 21 CAGs) show a comparable concentration dependent reduction of HTT mRNA quantification after (CUG)7 transfection. (b) In HD fibroblasts (GM04022) the mutant transcript, with 44 CAGs, shows a strong reduction of mutant HTT mRNA expression with increasing (CUG)7 AON concentrations, whereas the normal HTT transcript with 18 CAGs is reduced to a lesser degree. Expression levels are corrected for loading differences with ACTB and mRNA levels of the Mock I transfections were set on 100% (* P<0.05, ** P<0.01, n = 4).

