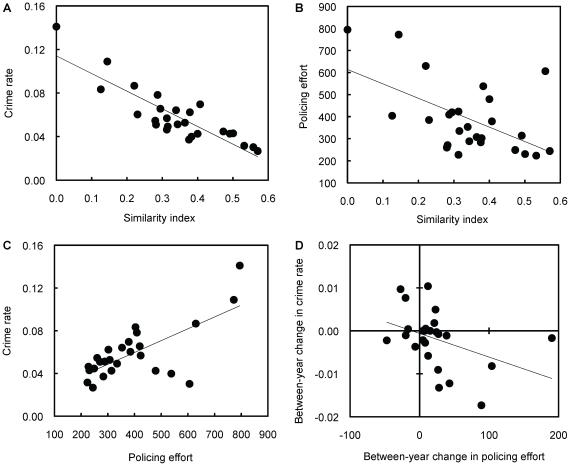
Figure 1. Testing predictions of evolutionary policing theory with data from human societies.
Significant correlations (indicated by trend lines) between: (a) the per capita crime rate and the similarity index; (b) the policing effort (per capita investment into policing) and the similarity index; (c) the policing effort and the per capita crime rate; (d) the between-year change in policing effort and crime rate. Each data point represents one out of the 26 cantons of Switzerland.

