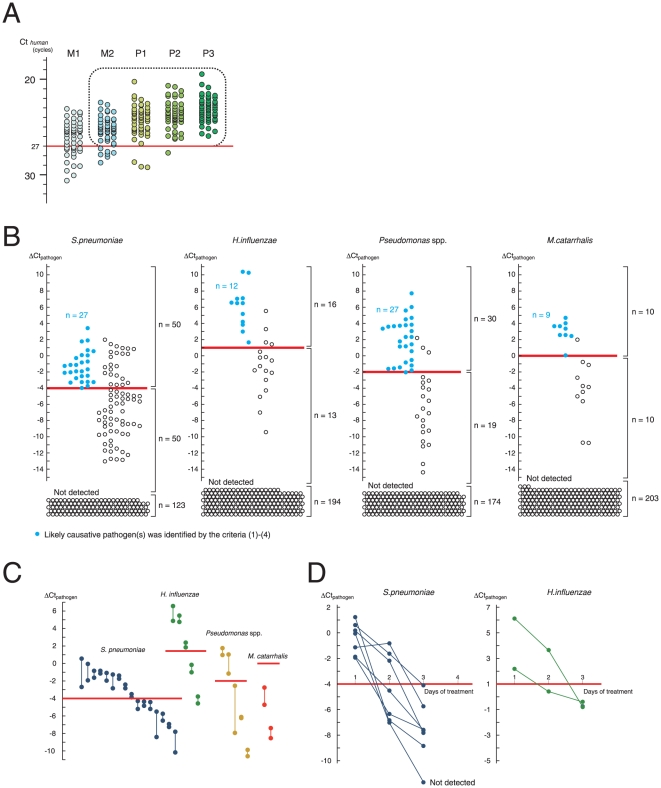
Figure 3. Determination of the ΔCt cutoff.
(A) Selection of purulent sputum. Sputum was classified by its gross appearance, with 50 samples studied for each classification. Purulent sputum had a Cthuman <27 (>7×10³ human cells/µL of sputum; Figure 2B ). Samples with M2–P3 appearance as well as a Cthuman <27 (enclosed by a dotted line) were studied further. Classification of the gross appearance of the sputum (M1, M2, P1, P2, and P3) are according to Miller and Jones [10]. (B) Determination of the ΔCt cutoff. ΔCtpathogen was measured for 4 representative commensal organisms (n = 223). Samples from patients with pneumonia in which a likely causative pathogen was identified using criteria (1)–(4) (see Methods) are shown as blue circles, and samples from patients with pneumonia in which none of criteria (1) – (4) was fulfilled were shown as white circles. The ΔCtpathogen cutoff (a red line) was defined as the smallest ΔCtpathogen for the blue circles. Sputum in which the pathogen was not detected and thus ΔCtpathogen was not assigned is shown at the bottom (labeled as “Not detected”). (C) Reproducibility of ΔCtpathogen measurements. Duplicate samples were isolated from a single patient in a single day (n = 28), and each of the duplicate samples was independently measured for ΔCtpathogen. Both of the measurements provided ΔCtpathogen located on the same side (above or below) of the cutoff. Red line: the cutoff for each organism. (D) Temporal profile of ΔCtpathogen during antibiotic treatment. A single sample set contains multiple sputum samples isolated from a single patient during antibiotic treatment. A total of 9 consecutive sample sets that included 7 of pneumonia with ΔCtpathogen for S. pneumoniae > cutoff and 2 of pneumonia with ΔCtpathogen for H. influenzae > cutoff at day 1 were studied. ΔCtpathogen decreased to below the cutoff in the course of treatment.

