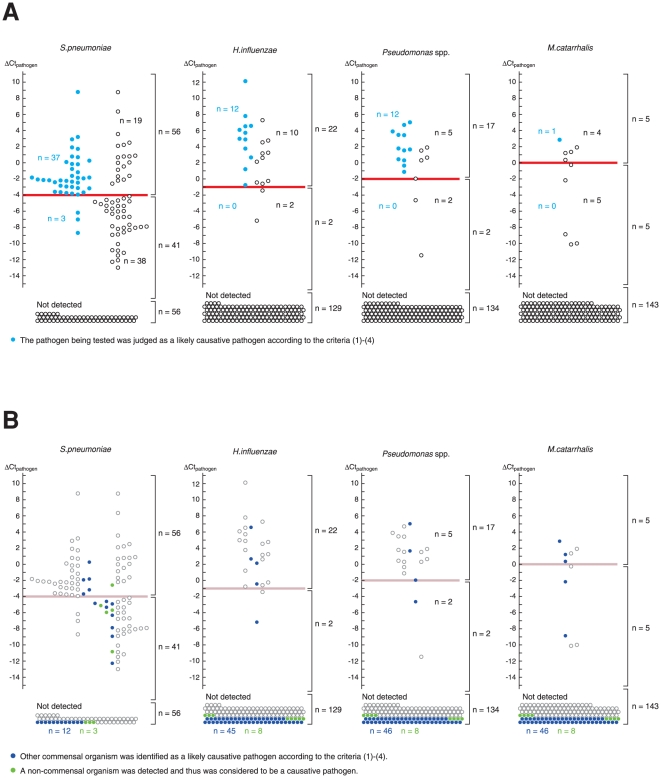
Figure 4. A prospective study.
(A) ΔCtpathogen for each commensal organism (n = 153). Samples in which real-time PCR failed to detect the organism are shown at the bottom (“Not detected”). The ΔCtpathogen cutoff demarcated well the samples obtained from the patients in whom the likely causative pathogen was identified by criteria (1) – (4). (B) Interrelationship between the pathogens detected. Samples obtained from the patients in whom the other 3 commensal organisms were identified as a likely causative pathogen or samples in which a non-commensal organism was detected by real-time PCR are colored. Most of the colored circles are located below the cutoff line.

