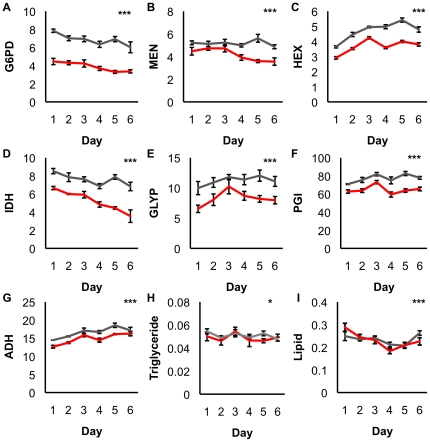
Figure 7. Enzyme activities, lipids and triglycerides were assayed every 24 hours for 6 days in SOD1-nulls (red line) and SOD+ controls (grey line).
(A) G6PD, F3,56 = 99.18, p<0.0001 (B) MEN, F3,56 = 15.60, p<0.0001 (C) HEX, F3,56 = 32.56, p<0.0001 (D) IDH, F3,56 = 65.62, p<0.0001 (E) GLYP, F3,56 = 12.77, p<0.0001 (F) PGI, F3,56 = 23.0, p<0.0001 (G) ADH, F3,56 = 22.80, p<0.0001. Each point in the line represents mean activity (OD units) for 5 samples at that time point ± SEM. (H) Triglyceride concentration, each point in the line represents mean triglyceride concentration (mmol/L standardized per mg wet weight) for 5 samples at that time point ± SEM, F3,56 = 0.3857, p = 0.9854 (I) Lipid concentration, each point in the line represents mean lipid concentration for 10 samples at that time point ± SEM, F3,117 = 428.90, p<0.0001. Significant differences denoted as: ‘*’ indicates p<0.05, and ‘***’ indicates p<0.0001, as determined by ANCOVA.

