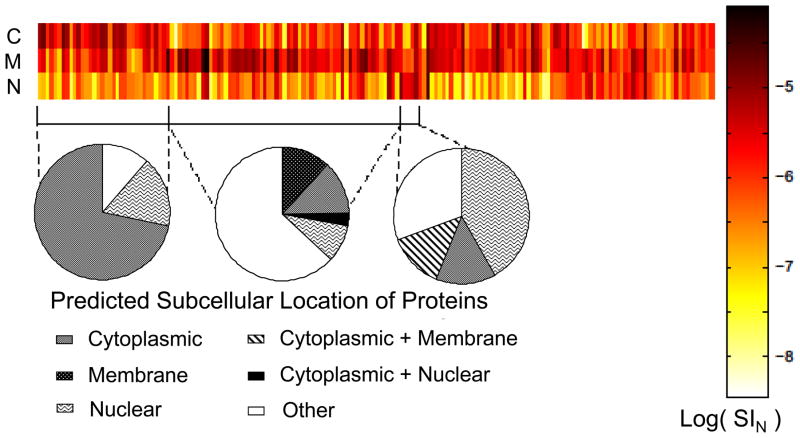
Figure 3.
Heat map visualizing the relative distribution of the 175 most abundant proteins detected in all three fractions of all groups and replicates. C, M, and N fractions show selective enrichment. Relative subcellular distributions are shown as pie charts under each bracketed area of enrichment. All biological replicates were pooled.

