
Figure 7.
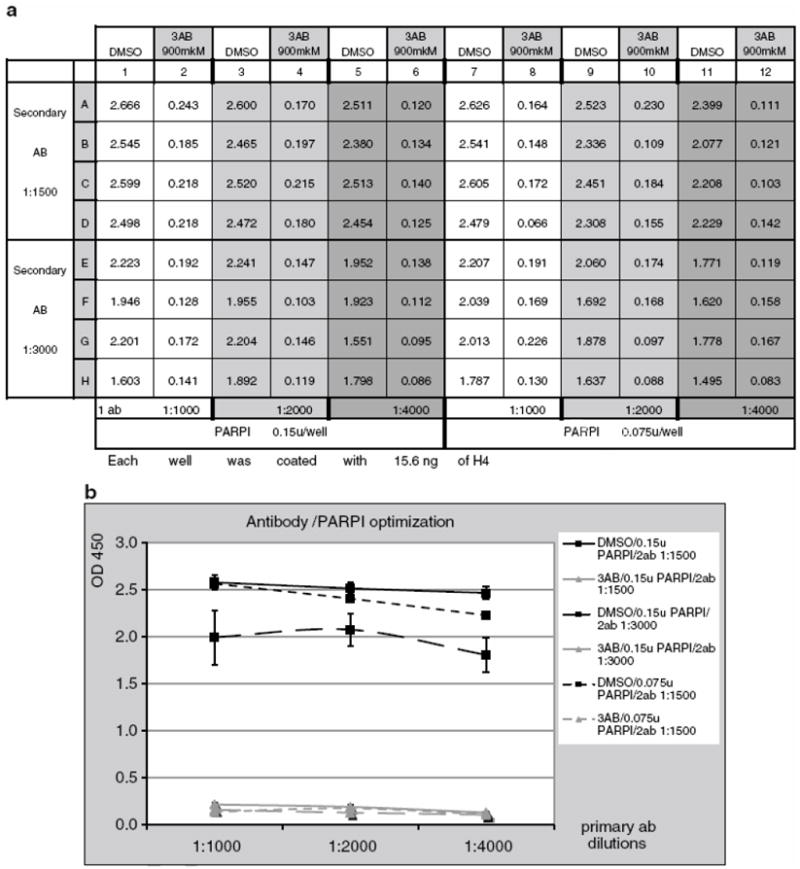
Primary and Secondary Antibody Optimization, Optimization of PARP1 Amount
(a) Plate setup and absorbance readings for primary and secondary antibody optimization and optimization of PARP1 amount. 10H primary antibody dilutions: columns 1, 2, 7, 8: 1:1000; columns 3, 4, 9, 10: 1:2000; columns 5, 6, 11, 12: 1:4000. Amount of PARP used in reaction: columns 1-6: 0.15 u and columns 7 -12: 0.075U. Secondary antibody dilutions: rows A-D: 1:1500; rows F-H: 1:3000.
(b) Primary and secondary antibody dilutions optimization. Amount of PARP1 in reaction. Secondary antibody dilution 1:3000 reduces sensitivity of reaction, while for primary antibody, a dilution of 1:4000 will also give a good DMSO/3AB signal ratio. Decreasing the amount of PARP1 to 0.075 U/well also does not significantly change DMSO/3AB signal ratio.