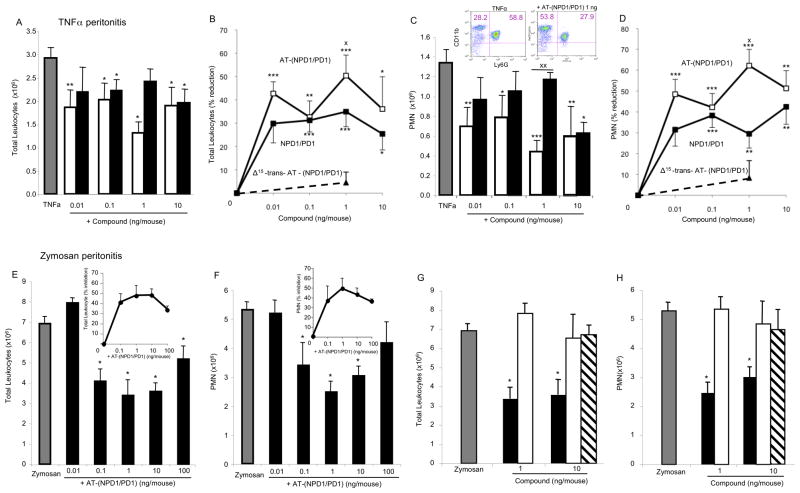
Figure 5. AT-(NPD1/PD1) reduces leukocyte infiltration in peritonitis: direct comparison to NPD1/PD1.
Panels A-D: Peritonitis was initiated by peritoneal injection of 500 ng TNFαalone, TNFαplus synthetic AT-(NPD1/PD1) (0.01 – 10.0 ng) or NPD1/PD1 (0.01 – 10 ng). Peritoneal lavages were obtained at 4 h and leukocytes were enumerated (see Experimental Procedures). (A) Total leukocyte numbers, (B) dose-response: percent reduction of total leukocytes, (C) total PMN numbers and (D) dose-response: percent reduction of PMN infiltration. Representative flow cytometry dot plots (C, inset). TNFα, gray bars; AT- (NPD1/PD1), black bars; NPD1/PD1, white bars. Values are mean + SEM of n=7. Panels E-H: AT-(NPD1/PD1) dose response and direct comparison to DHA. Zymosan A alone (100 μg/mouse), zymosan A plus AT-(NPD1/PD1) (0.01 – 100 ng/mouse) or zymosan A plus DHA (1 and 10 ng/mouse) were injected (i.p.) and lavages were obtained at 4 h. (E and G) Total exudate leukocyte (PMN, monocyte, lymphocyte) numbers, (F and H) total PMN. Panels E and F insets: percent reduction in total leukocytes and PMN. Zymosan A, gray bars; AT-(NPD1/PD1), black bars; DHA, white bars; Δ15-trans-AT-(NPD1/PD1), striped bars. All values mean + SEM of n=3. *p<0.05, **p<0.01, ***p<0.001 versus vehicle; Xp< 0.05, XXp<0.01 AT-(NPD1/PD1) versus NPD1/PD1. Using one-way and two-way ANOVA indicated that AT-NPD1 and NPD1/PD1 were not significantly different from each other, P > 0.05.

