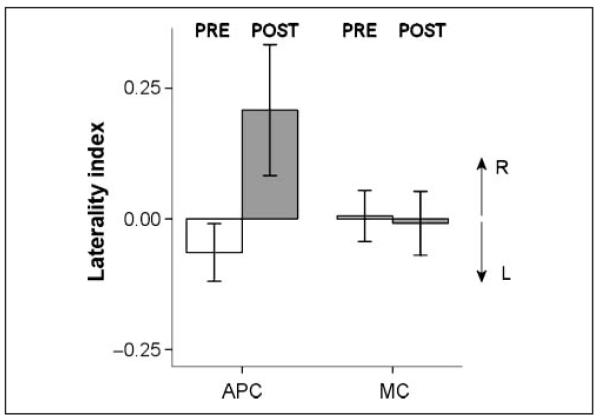
Figure 2.

Experiment 1. The change in laterality index [(HR – HL)/(HR + HL), where HR and HL were hit rates for right and left targets, respectively] from pre- to post-TMS sessions for the APC and MC stimulation. The right eye was rotated to the left of the sagittal plane. White bars = pre-TMS session. Gray bars = post-TMS session. Positive values for laterality index correspond to larger hit rates in the right versus left visual field. Error bars show one standard error.
