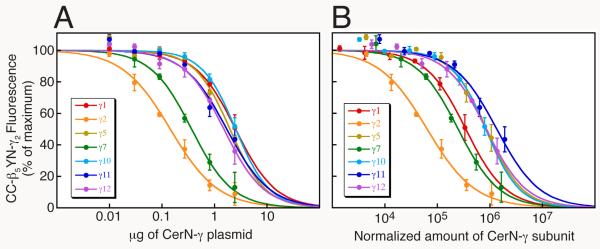
FIG. 3.
β5 interacts preferentially with γ2 rather than γ1, γ5, γ7, γ10, γ11, or γ12. (A) Competition between Cer-N-γ subunits and YFP-N-γ2 for limiting amounts of CFP-C-β5. The intensity of CFP-C-β5YFP-N-γ2 was measured in the presence of each Cer-N-γ subunit or empty vector. HEK-293 cells were transfected with 0.6 μg each of plasmids expressing CFP-C-β5 and YFP-N-γ2, and the indicated μg of each Cer-N-γ plasmid. The total amount of plasmid in each transfection was maintained at 3.63 μg using pcDNAI/Amp. Values represent the means ± S.E. from 3 experiments performed in duplicate. (B) CFP-C-β5YFP-N-γ2 intensity is expressed as a function of the relative amounts of co-expressed Cer-N-γ. Expression levels were determined in HEK-293 cells transfected with 0.6 μg each of plasmids expressing CFP-C-β5 and pcDNAI/Amp, and 0.03, 0.09, 0.27, or 2.43 μg of each Cer-N-γ plasmid. The total amount of plasmid in each transfection was maintained at 3.63 μg using pcDNAI/Amp. The expression levels of the Cer-N-γ subunits varied linearly and the data were fit by linear regressions. The plasmid amounts used in (A) were multiplied by Cer-N-γ expression/μg plasmid to yield the normalized amount of each Cer-N-γ subunit. CC indicates CFP-C and YN indicates YFP-N. (Reprinted from (14) with permission from the American Society for Pharmacology and Experimental Therapeutics and from (18) with permission from Elsevier.)

