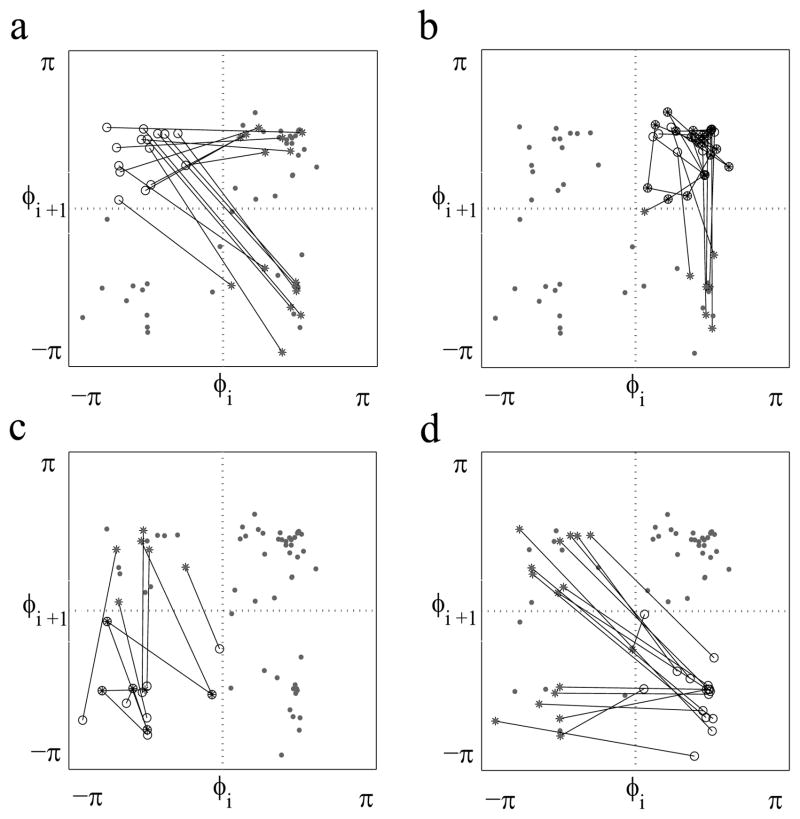
FIG. 2.
An example of the first-return map for two coupled Lorenz oscillators. All four first-return plots have the same data points (gray circles), but each subplot (a–d) presents the evolution of points from one region (I, II, III, and IV, respectively). If a point evolves from one region to another region, then we represent it as ○–*. If a point evolves within the same region, then we represent it as ○–○. Thus each plot shows the transitions from a corresponding part of the phase space. We can compute the transition rates r1,2,3,4 from the panels (b), (d), (c), and (a), respectively.

