Figure 8.

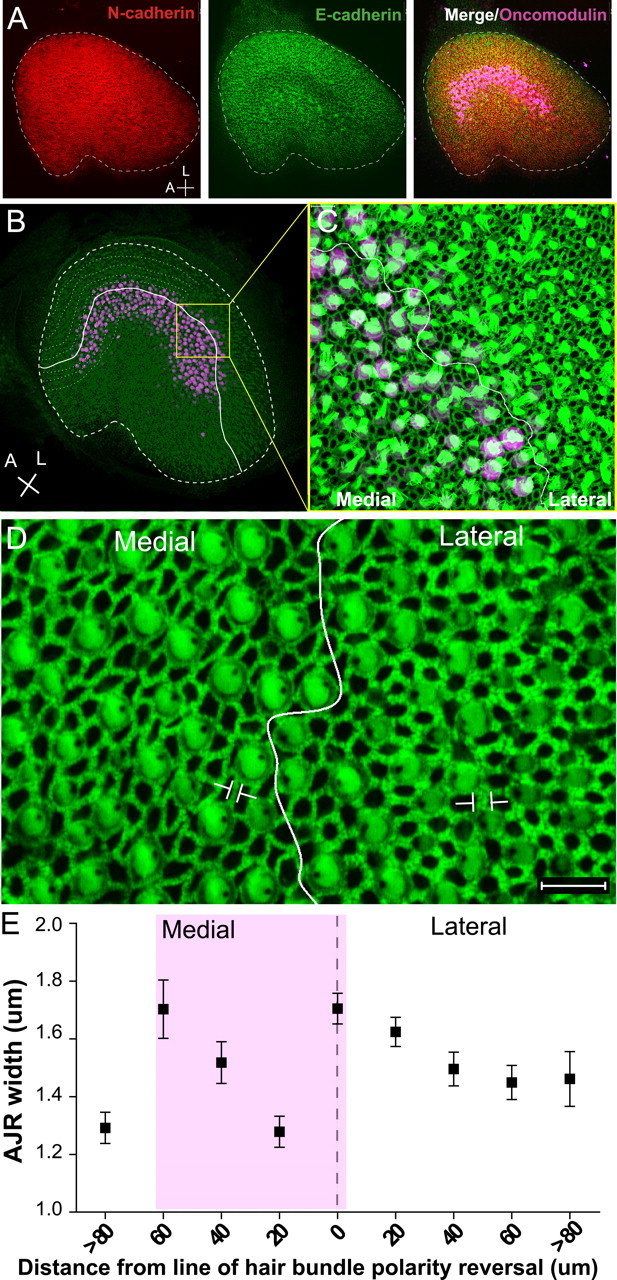
The width of circumferential F-actin bands in P2 mice utricles is thinnest in striolar supporting cells. A, Image of a P2 mouse whole-mount utricle cultured with the vehicle for 48 h and labeled for E-cadherin (green), N-cadherin (red), and striolar marker oncomodulin (purple). Scale bars, 50 μm. B, P2 mouse utricle labeled for F-actin (green) and oncomodulin (purple). The solid white line marks the line of hair bundle polarity reversal, and the thick dashed line marks the outer edge of the sensory epithelium. The thinner dashed lines illustrate transects followed in the quantification process, in which the widths of 100 AJRs along each side of the line of polarity reversal were measured in relation to the shortest distance from the measured cell to the line of reversal. C, Higher-magnification image of B. D, High-resolution image showing the difference in widths of F-actin bands in the regions lateral and medial to the line of polarity reversal (white line) at the level of the striola. E, Quantification of AJR widths plotted as a function of the shortest distance to the line of hair bundle polarity reversal. Data were binned in 20 μm intervals. Data point 0 and dashed line indicate the line of reversal. Purple shadowing represents the location of the striola.
