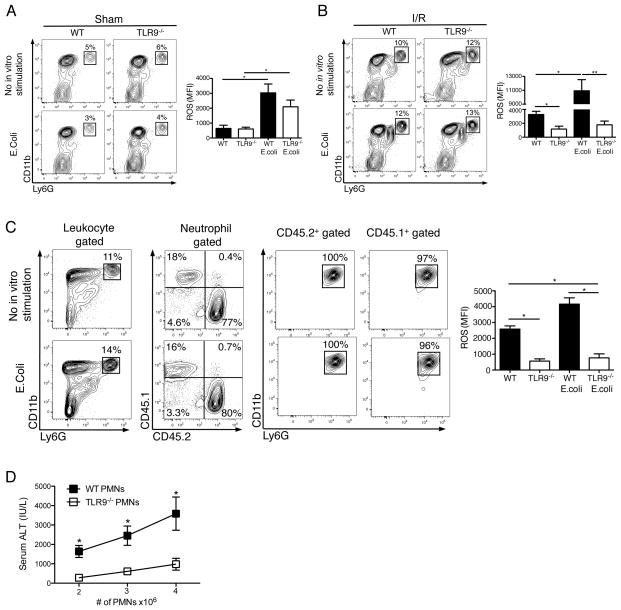
Figure 5. Liver I/R increases neutrophil oxidative burst via TLR9.
CD45+ NPCs from the ischemic livers of WT and TLR9−/− mice 12 h after (A) sham laparotomy or (B) I/R were isolated. Contour plots depict neutrophils as a percentage of hepatic leukocytes in the presence or absence of E.coli stimulation in vitro. Bar graphs depict mean ROS production ± SEM by WT and TLR9−/− neutrophils pooled from 3 separate experiments, each with similar results. (C) 4 × 10⁶ WT (CD45.1+) neutrophils were injected into TLR9−/−(CD45.2+) recipients just prior to I/R. 12 h later, ischemic liver CD45+ NPCs were isolated and then assessed for the presence of donor and recipient neutrophils. The bar graph depicts mean ROS production ± SEM by donor and recipient neutrophils pooled from 2 separate experiments, each with similar results. (D) I/R was performed in TLR9−/− mice following intrasplenic injection of varying numbers of WT or TLR9−/− neutrophils (PMNs). Serum ALT was measured 12 h later. Data in (D) are representative of 3 independent experiments. (A-D) were performed with (4–6 mice/group). *p<0.05; **p<0.01.

