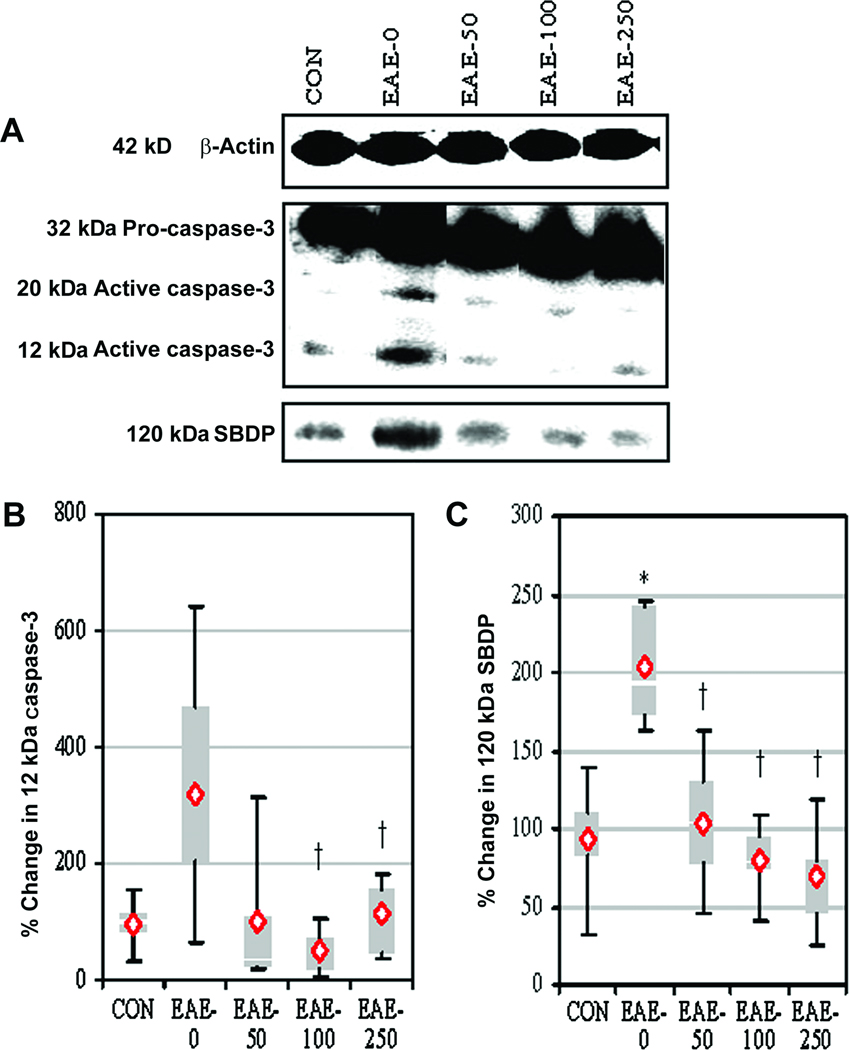
Fig. 8.
Calpeptin decreased caspase-3 activation and activity in EAE. (A) Representative blot and (B) average scanning densitometry values of (B) 12-kDa active caspase-3 and (C) caspase-3 activity as determined in the formation of caspase-3-cleaved 120-kDa SBDP. Results were presented as box-plot of inter-quartile data with the white line denoting the median expression. Diamonds represented mean protein expression (n = 4 to 5 per group, * P ≤ 0.05 compared with CON, and † P ≤ 0.05 for EAE-0 versus EAE-calpeptin).

