
Table 2.
Inhibitory activity and Test Set Data for the 3D QSAR studies
| pIC50 | ||||
|---|---|---|---|---|
| # | Structure | IC50 | Obs | Pred |
| 21 | 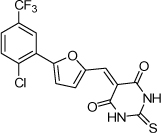 |
1.3 µM | 5.89 | 5.30 |
| 22 | 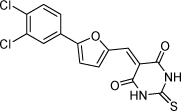 |
2.1 µM | 5.68 | 5.61 |
| 23 | 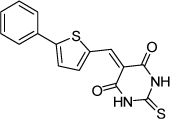 |
1.2 µM | 5.92 | 5.61 |
| 24 | 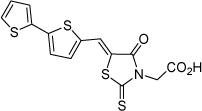 |
2.3 µM | 5.64 | 5.32 |
| 25 | 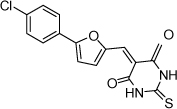 |
4.4 µM | 5.36 | 5.34 |
| 26 | 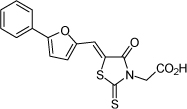 |
16.6 µM | 4.78 | 4.94 |
| 27 | 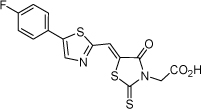 |
22.4 µM | 4.65 | 4.33 |
| 28 | 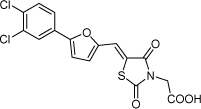 |
5.6 µM | 5.25 | 4.97 |
| 29 | 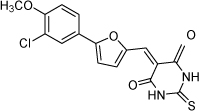 |
3.0 µM | 5.52 | 5.33 |
| 30 | 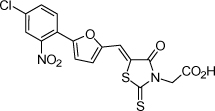 |
0.5 µM | 6.30 | 6.27 |