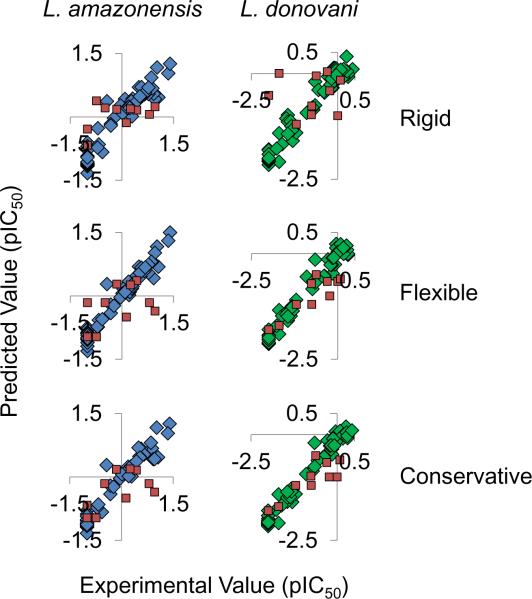
Figure 6.
Internal (blue and green) and external (red) predictions. The internal predictions are those for the training compounds and external predictions are for the testing dataset of compounds. The L. amazonensis experimental versus predicted results are shown in blue (left) and those for L. donovani in green (right). The experimental versus predicted results from top to bottom are predictions from implementing rigid (top) and flexible (center) compounds. The conservative predictions (bottom) are essentially the more negative of the two pIC50 predictions resulting from the models with rigid and flexible compounds. Since the scale observed is the negative log of the IC50, this method reduces under prediction.

