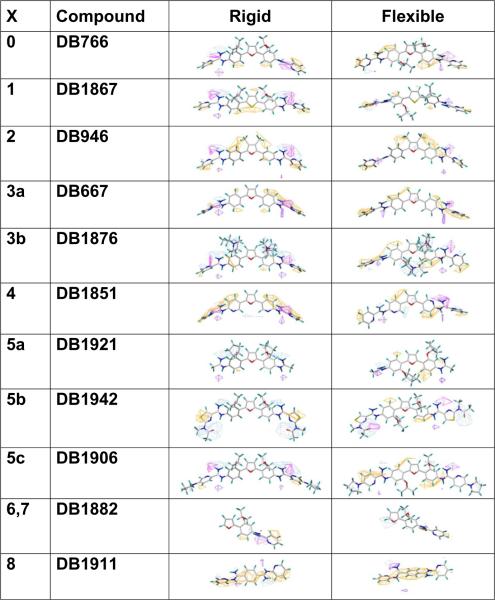
Figure 8.
CoMSIA findings with respect to Figure 1 and molecular descriptor potentials of Figure 7. The favored hydrophobic potentials have been changed to orange to improve visualization and insure that steric potentials were not displayed. The left most column consists of numbers correlated to positions of Figure 1. The column to the right consists of the compounds name. This is followed by the compounds and their respective molecular descriptor potentials for each the final models. To improve compound visibility, the results for only L. amazonensis are shown above. Results for L. donovani can be found in Supplemental Figure S2.

