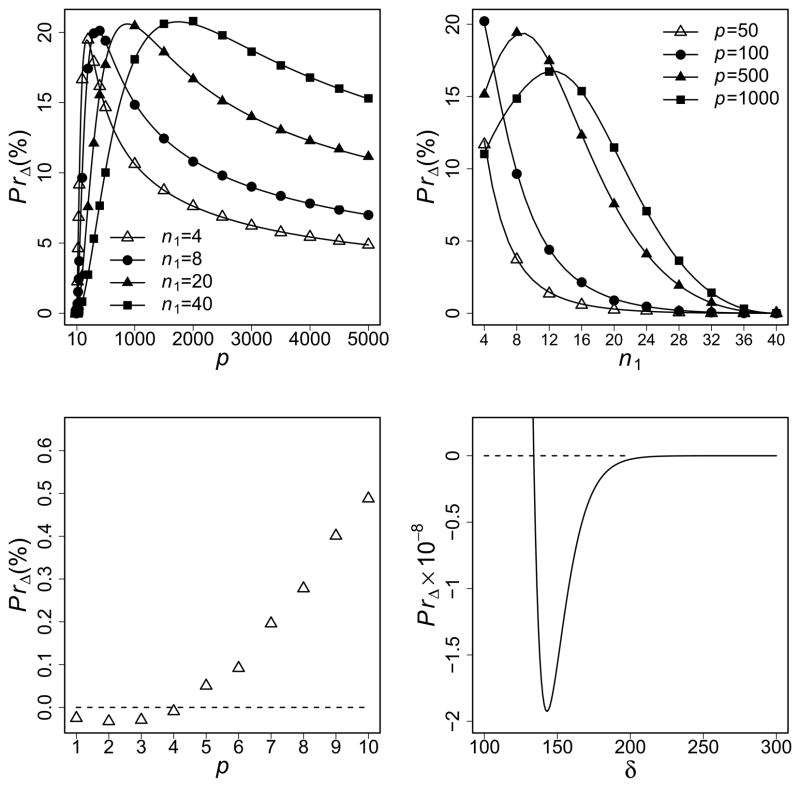
Figure 1.
PrΔ as functions of different factors (p, n1 and δ). The solid lines represent results using Equation (5). The symbols on the lines represent results using Equation (6). The dashed lines represent PrΔ = 0. We set n2/n1 = 5 except for the upper right panel and δ = 10 except for the lower right panel. Upper left: the results for different values of n1 are shown. Upper right: the results for different values of p are shown (n2 = 40). Lower left: use Equation (6) for small p (n1 = 4). Lower right: use Equation (5) for large δ (n1 = 4 and p = 50).

