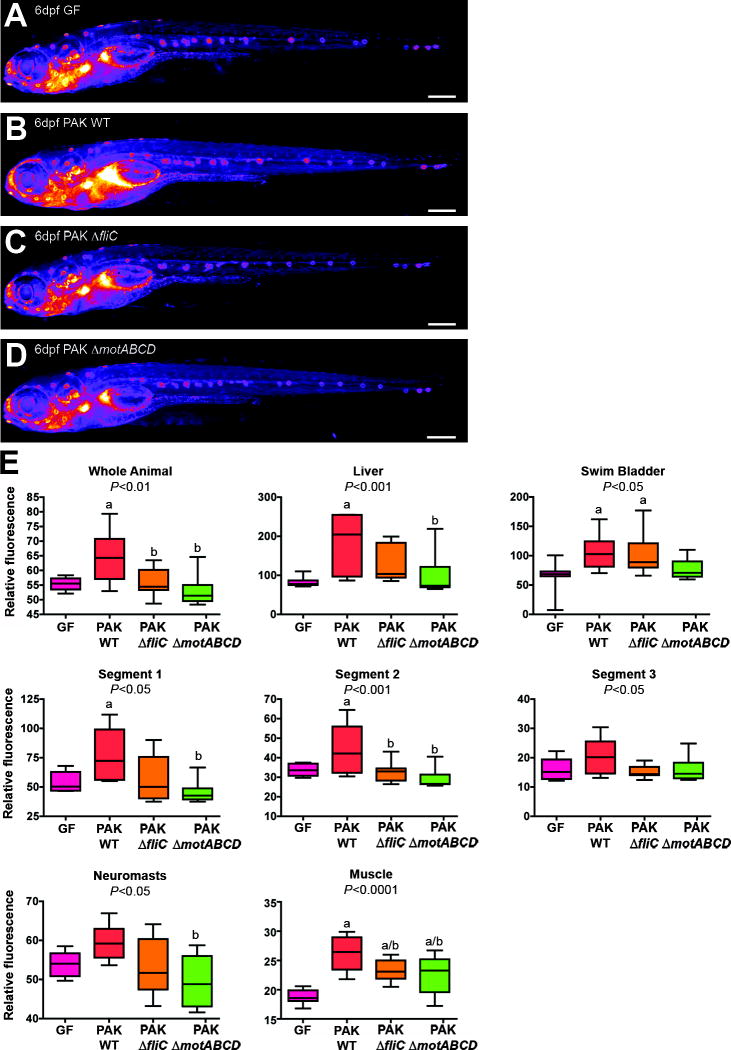
Fig. 7. P. aeruginosa flagellar function is required for NF-κB activation in gnotobiotic Tg(NFkB:EGFP) zebrafish.
Representative EGFP fluorescence heatmap images of 6dpf Tg(NFkB:EGFP) larvae raised GF (A), or mono-associated since 3dpf with wild type P. aeruginosa strain PAK (B) or deletion mutants PAK ΔfliC (C) and ΔmotABCD (D). (E) Densitometric quantification of relative EGFP fluorescence for whole animal, liver, swim bladder, intestinal segments 1, 2, and 3, neuromasts, dorsal root ganglia (DRG), and muscle (10 fish/condition). One-way ANOVA P-values are shown in each panel, with significant differences (Tukey’s post-test P<0.05) compared to GF (a) and PAK WT (b) indicated. Scale bars: 500μm (A–D).

