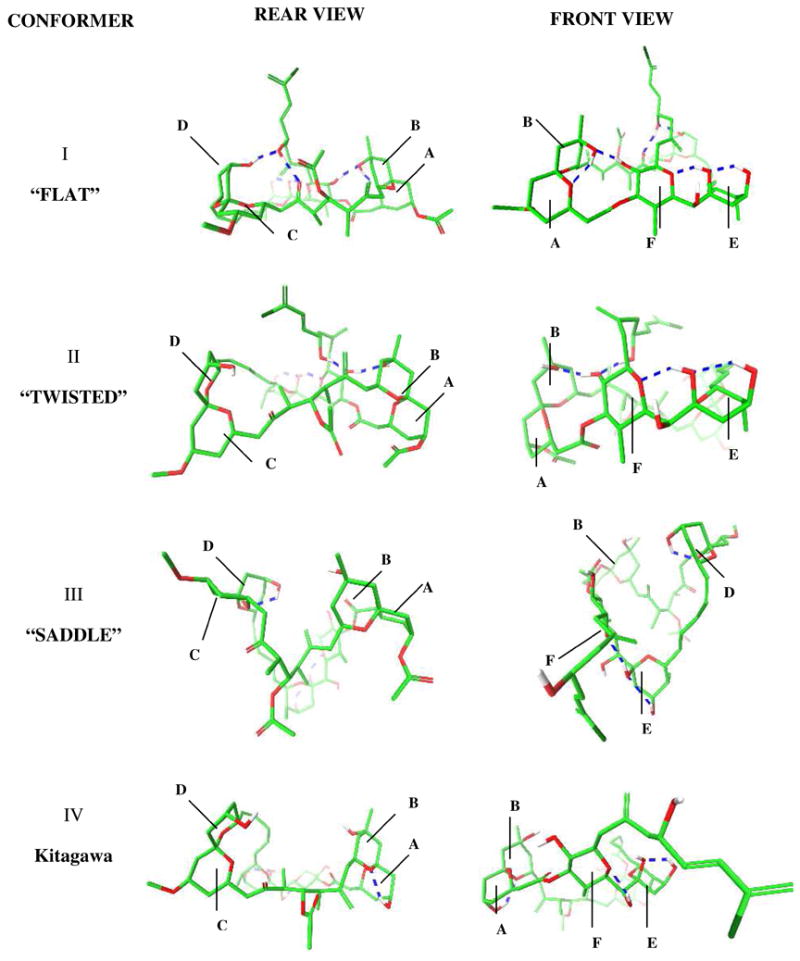
Figure 2.

Front and rear 3D views (see supporting information section for stereo view images) of the lowest energy conformations (I–III) calculated by conformational searches employing different solvation models and Kitagawa solution structure (IV). Blue dashed lines represent hydrogen bonds. Rings A–F are shown in each conformation.
