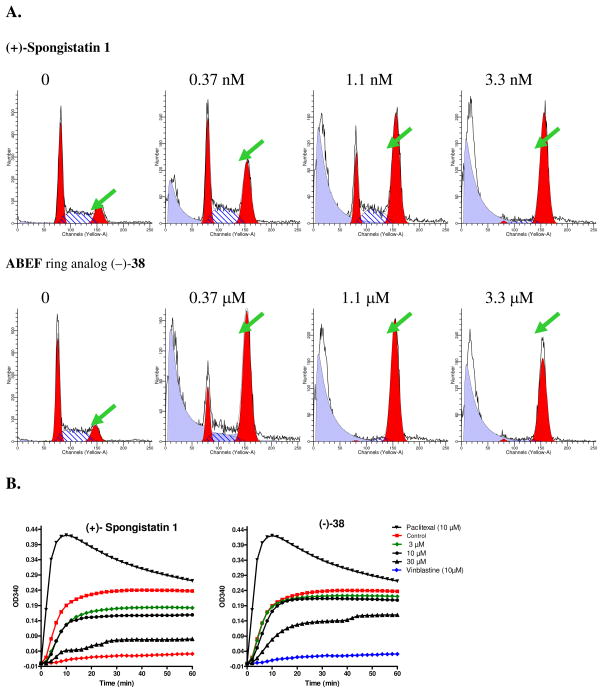
Figure 6.
A. G2/M cell cycle effects of spongistatin 1 and (−)-38. U937 cells were treated with either spongistatin 1 or the (−)-38 analog for 18 h. Samples were subject to flow cytometric cell cycle analysis. Data shown represent relative number of cells (Y axis) as a function of fluorescence intensity representing DNA content (X axis). B. Inhibition of in vitro tubulin polymerization. An in vitro tubulin polymerization assay was carried out in the presence of indicated compounds and concentrations. Tubulin polymerization curves shown here represent the relative amount of tubulin polymer (OD340, Y axis) over time (X axis).

