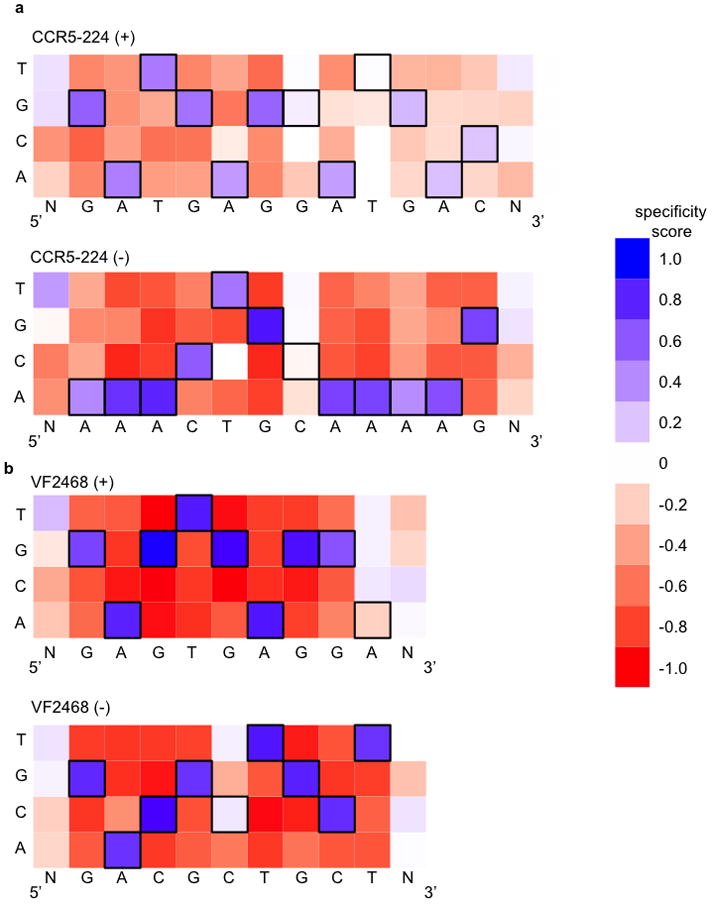
Figure 2. DNA cleavage sequence specificity profiles for CCR5-224 and VF2468 ZFNs.

The heat maps show specificity scores compiled from all sequences identified in selections for cleavage of 14 nM of DNA library with (a) 2 nM CCR5-224 or (b) 1 nM VF2468. The target DNA sequence is shown below each half-site. Black boxes indicate target base pairs. Specificity scores were calculated by dividing the change in frequency of each base pair at each position in the post-selection DNA pool compared to the pre-selection pool by the maximal possible change in frequency from pre-selection library to post-selection library of each base pair at each position. Blue boxes indicate enrichment for a base pair at a given position, white boxes indicate no enrichment, and red boxes indicate enrichment against a base pair at a given position. The darkest blue shown in the legend corresponds to absolute preference for a given base pair (specificity score = 1.0), while the darkest red corresponds to an absolute preference against a given base pair (specificity score = −1.0).
