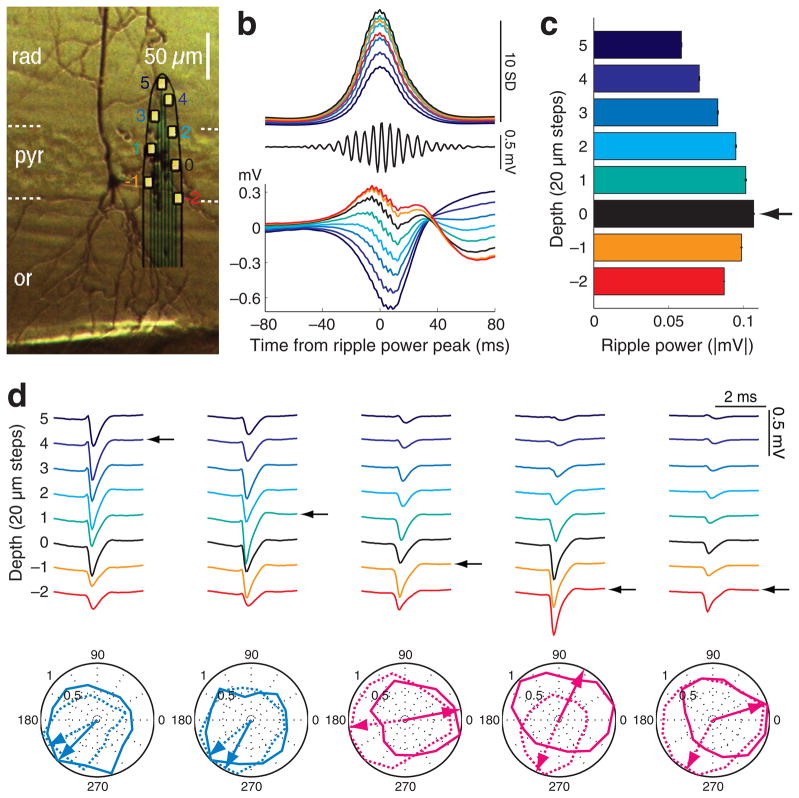
Figure 1. Spatial localization of neuronal somata in the CA1 pyramidal layer.
a, Biocytin-filled neuron in the deep CA1 pyramidal cell layer. Surrounding unstained neuronal somata provide reference for the recording sites of the superposed silicon probe. Color-coded recording sites ( 2 to 5) are the same in parts b to d. 0, designates the middle of the layer, determined by the maximum ripple power (black in b d). b d, data from a shank from a single session. b, Middle, filtered (140–230 Hz) single trace at depth 0. Bottom, average LFP traces triggered by ripple power peaks (n = 2,635), recorded at different depths. Top, mean integrated ripple power at different depths, normalized by the standard deviation of ripple power at depth 0. c, Ripple power at different recording depths (mean ± S.E.M., from part b, top). The recording site with the largest ripple power identifies the middle of the pyramidal layer (arrow, reference depth 0), and serves for the determination of the distance of the recorded cell body of individual neurons from the middle of the layer. d, Average waveforms of 5 simultaneously recorded neurons (1Hz–5 kHz). Arrows indicate the putative position of the neuron’s soma relative to the reference depth, inferred from the largest spike amplitude26. Two ‘superficial’ neurons (i.e., above reference depth 0) and three ‘deep’ neurons (below reference depth 0) are shown. Polar plots of spike phase distribution of the 5 neurons referenced to the theta oscillation in the CA1 pyramidal layer (peak of theta = 0, 360 °, trough = 180 °). Normalized contour plots and preferred spike phase of the neurons (arrows) during maze running (dotted) and REM sleep (solid). Magenta polar plots represent REM-shifting neurons and light blue plots non-shifting cells. Positive polarity is up in all figures.

