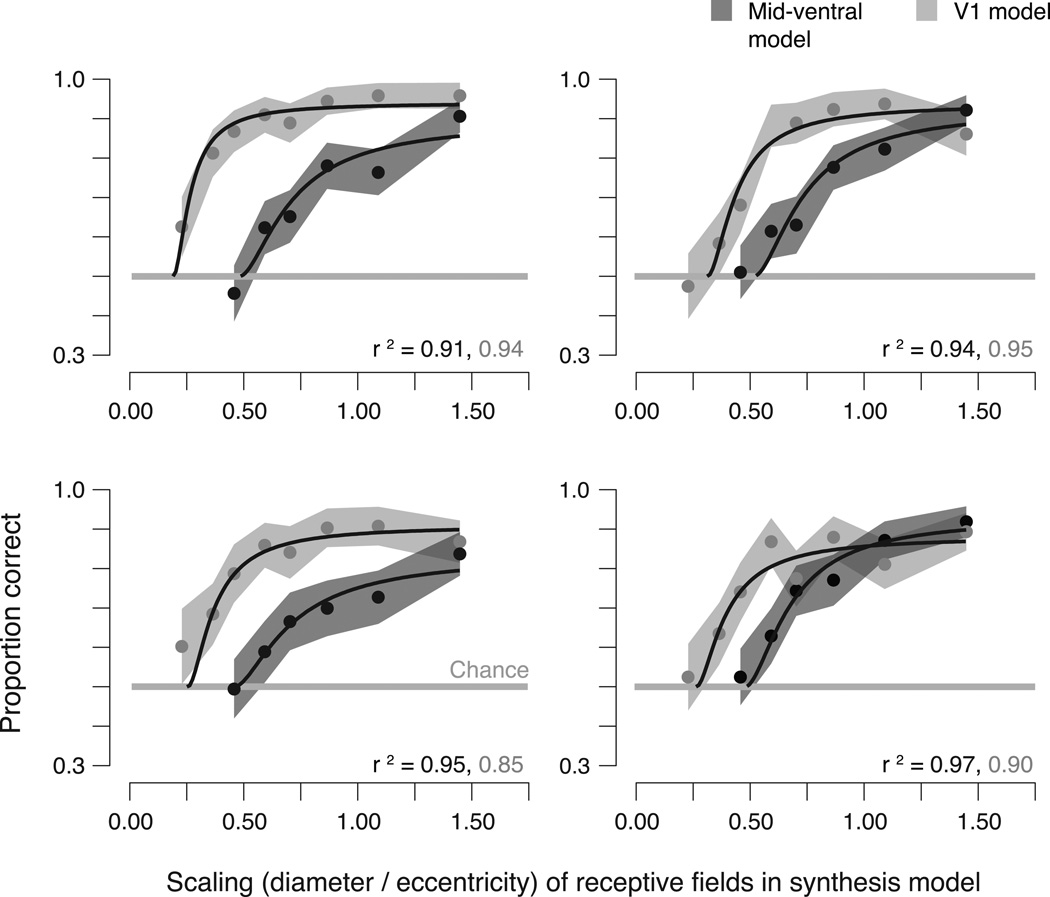
Figure 3.
Metamer experiment results. Each panel shows, for an individual observer, the proportion of correct responses in the ABX task, as a function of the scaling parameter (ratio of receptive field diameter to eccentricity) of the model used to generate the stimuli. Data are averaged over stimuli drawn from four naturalistic images. Dark gray points: mid-ventral model (see Fig. 2). Light gray points: V1 model (see Supplementary Fig. 2). Shaded region, 68% confidence interval obtained using bootstrapping. Gray horizontal line: Chance performance. Black lines: Performance of observer model with critical scaling and gain parameters chosen to maximize the likelihood of the data for each individual observer (see Methods and Results). r2 values for the fits indicated at the bottom of each plot.

