Figure 6.
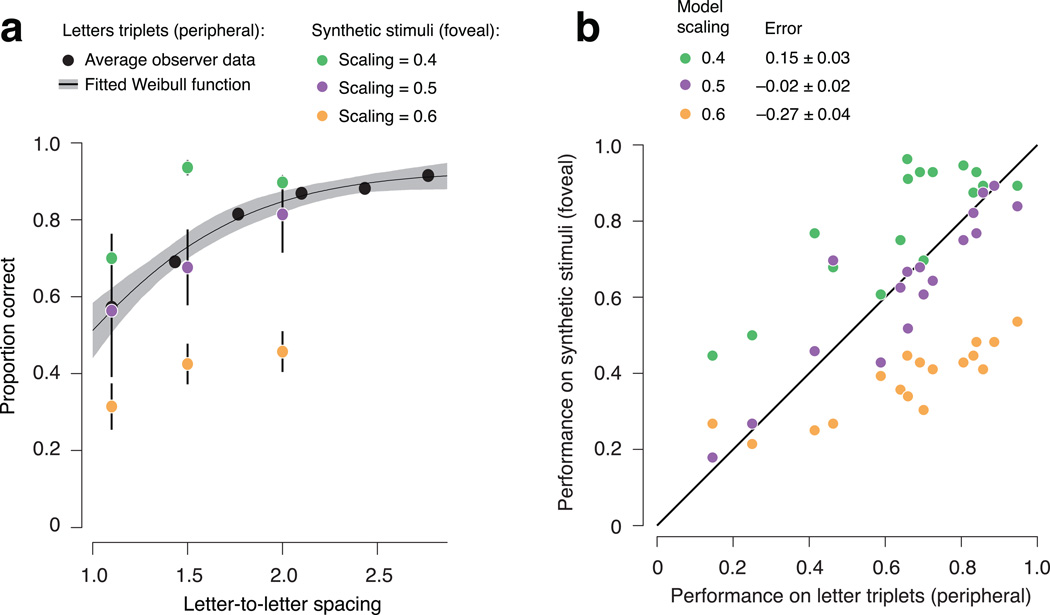
Crowding experiment. (a) Recognition performance for two different kinds of stimuli: peripherally viewed triplets of letters, and foveally viewed stimuli synthesized to produce model responses identical to their corresponding letter triplets. Black dots: average recognition performance for a peripheral letter between two flankers, as a function of letter-to-letter spacing (n = 5 observers). Black line: best fitting Weibull function. Gray shaded region: 95% confidence interval for fit obtained through bootstrapping. Synthetic stimuli were generated for spacings yielding approximately 50%, 65%, and 80% performance, based on the average psychometric function. Colored dots: average recognition performance for model-synthesized stimuli (foveally viewed). Different colors indicate the scaling parameter used in the model (purple: 0.5, orange: 0.4, green: 0.6). Error bars: standard deviation across observers. (b) Comparison of recognition performance for the peripheral letter triplets (from the psychometric function in panel a) and the foveally-viewed synthetic stimuli (colored dots from panel a). Each point represents data from a single observer for a particular spacing and scaling. Two observers performed an additional condition at a larger eccentricity (not shown in panel a), to extend the range of performance levels (the six left-most points).

