
Fig 2.
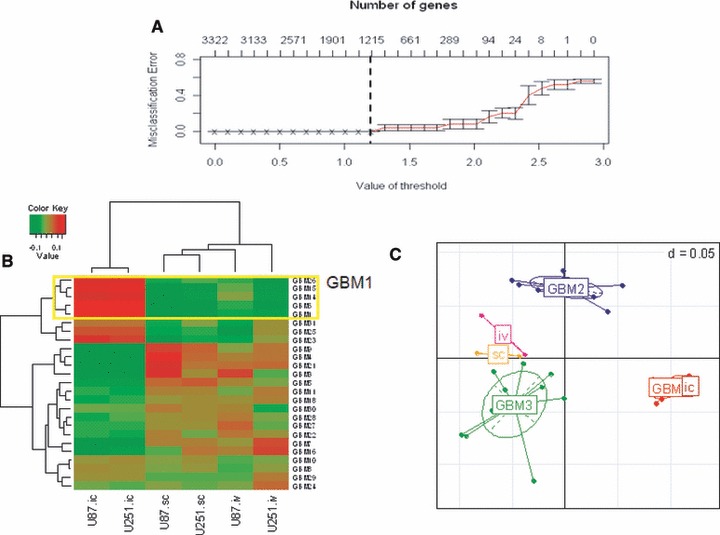
Supervised model of GBM sub class and association of cell line models using the subset of genes selected by the model (n = 1215). (A) Cross-validated error curves from the nearest shrunken centroid classifier with the three subclasses of GBM patient samples. (B) Heatmap of correlation between GBM and cell line sample data showing a close cluster between GBM1 with ic model (C) Principle component analysis showing the association of ic cell lines with GBM1 in comparison with other samples in the dataset.